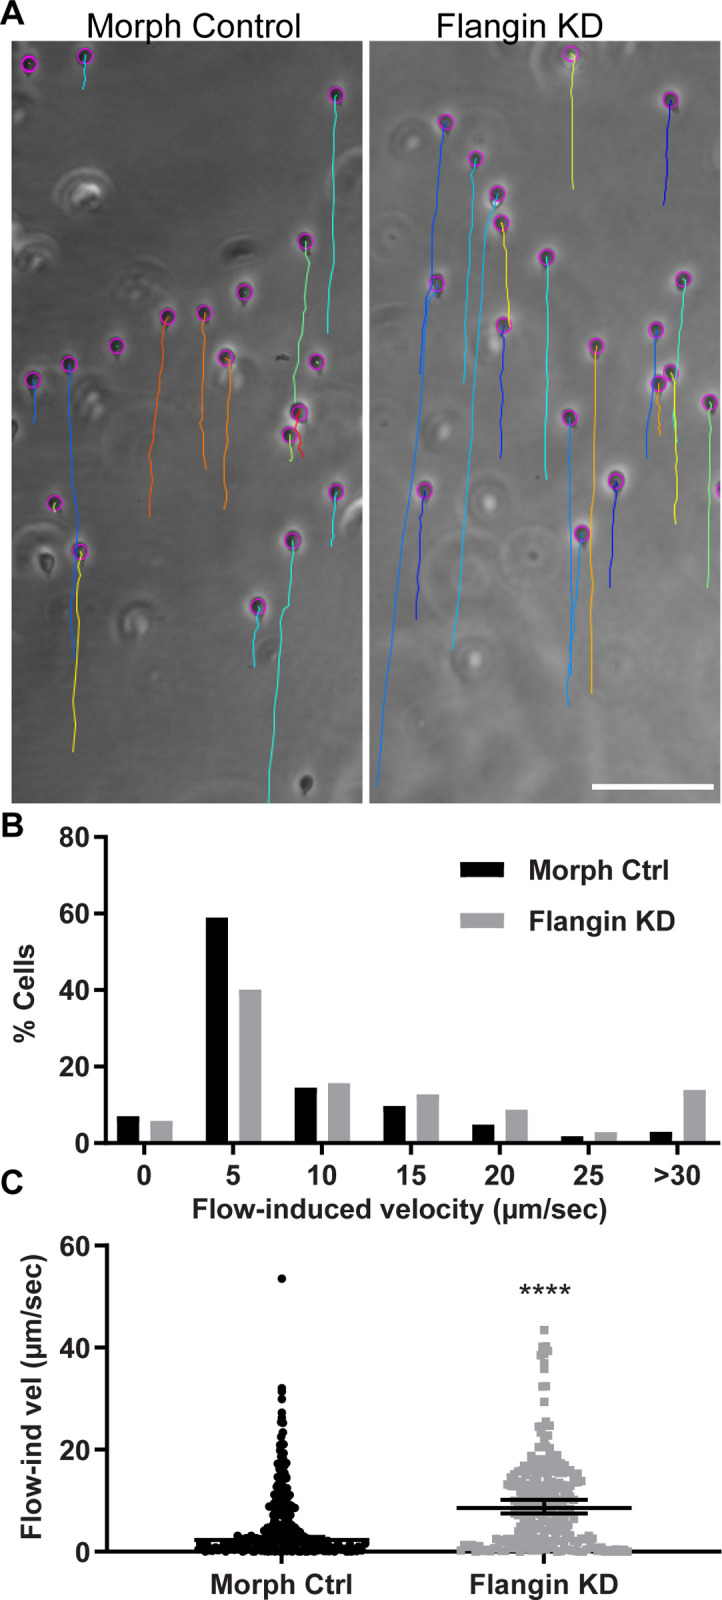
Fig 7. The flange has a role in attachment.

(A) Flow chamber assay to test the role of the flange in attachment. A flow rate of 100μl/s induced sliding. The paths of cells were followed with TrackMate, the paths at the end of the 10s challenge are indicated by the colored lines. See S9 Movie. (B) Histogram of flow induced velocities for the standard morpholino control n = 268 and anti-Flangin morpholino treated cells n = 248 analyzed from six challenge assays. (C) Plot of measured values where error bars are median with 95% confidence interval; statistical significance determined with a Mann-Whitney U test. ****, P<0.0001. Scale bar = 100 μm.
