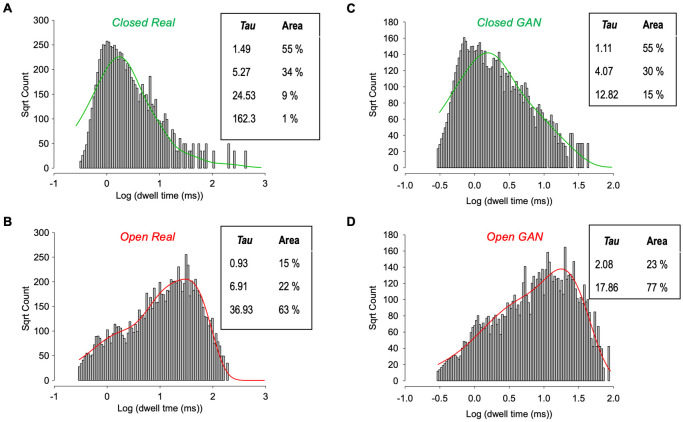
Fig 4. Comparative kinetic analyses of real and DeepGANnel simulated data.
(A and B) Kinetic analysis from the real (input) single molecule data with closed times (A) fit with 4 exponentials and open times (B) fit with 3 exponentials. The respective time constants and weights are displayed in the inset tables. (C and D) Kinetic analysis from the GAN simulated (output) single molecule data with closed times (C) fit with 3 exponentials and open times (D) fit with 2 exponentials. The respective time constants and weights are again displayed in the inset tables.

