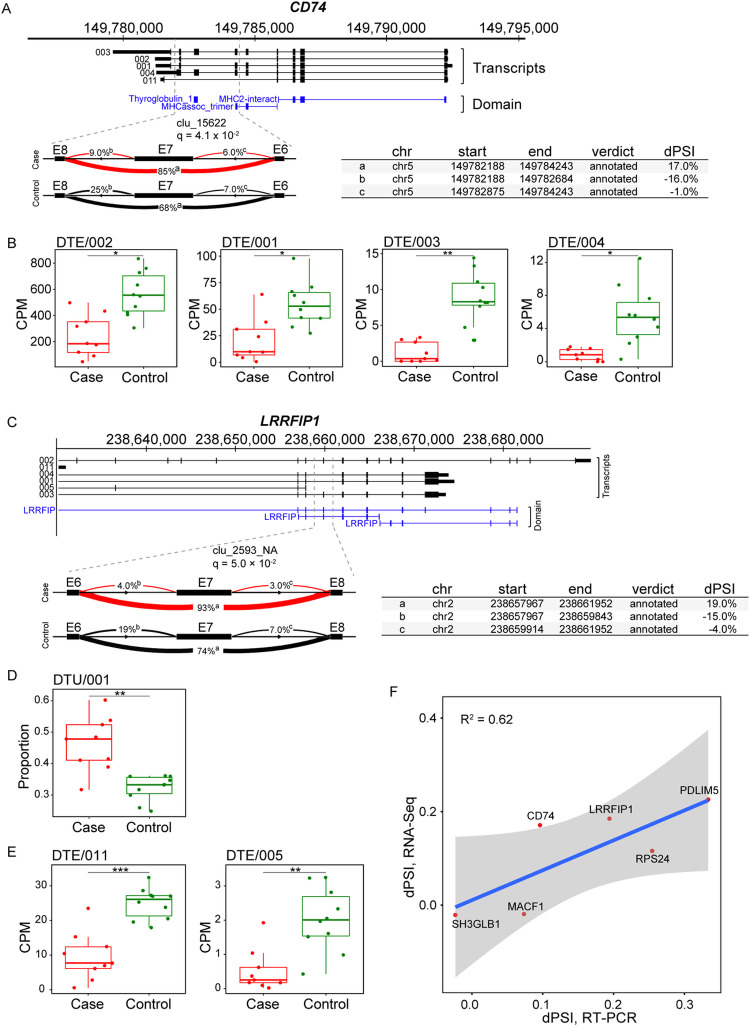
Fig 4. Aberrant local splicing and transcript isoform usage in COVID-19.
(A) A significant differential splicing intron cluster in CD74 (clu_15622; chr5: 149,782,188–149,784,243) showing increased exon 7 (E7) skipping in COVID-19. Increased intron usage in COVID-19 cases compared to control is highlighted in red. Protein domains are annotated as thyroglobulin_1, thyroglobulin type 1 repeats; MHCassoc_trimer, Class II MHC-associated invariant chain trimerisation domain; MHC2-interact, MHC2 interacting. Visualization of splicing events in cluster clu_15622 with changes in PSI (dPSI) for COVID-19 group comparisons. FDR-corrected P values (q) are indicated for each comparison. Covariate-adjusted average PSI levels in cases (red) versus controls (black) are indicated at each intron. (B) Bar plots for changes in gene expression for CD74-002, CD74-001, CD74-003 and CD74-004. CD74-003 is the canonical sequence. * posterior probability > 0.5; ** posterior probability > 0.7; *** posterior probability > 0.9. (C) Whole-gene view of LRRFIP1 highlighting (dashed lines) the intron cluster with significant differential splicing in COVID-19 (clu_2593_NA; chr2: 238,657,967–238,661,952). LRRFIP, Leucine-rich repeat flightless-interacting protein domain. (D and E) Bar plots for changes in transcript usage and gene expression for LRRFIP1 transcripts. * posterior probability > 0.5; ** posterior probability > 0.7; *** posterior probability > 0.9. (F) Scatter plots comparing the average percent spliced-in (PSI) of exon skipping events called by LeafCutter from RNA-seq data to semi-quantitative PCR. A total of 6 genes were tested in 9 COVID-19 cases and 10 controls. Gene names are indicated at each point. Regression lines with 95% confidence intervals are shown in blue and grey, respectively and the corresponding R2 values are shown at the top-left of the plot.

