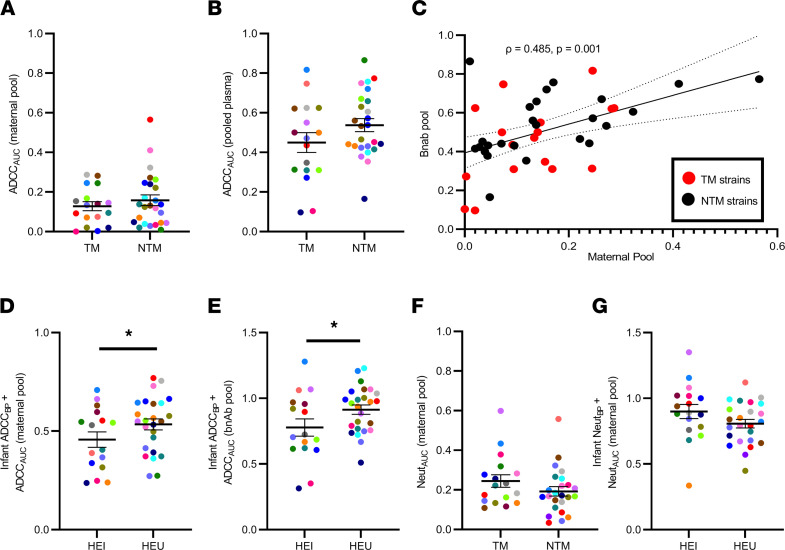
Figure 3. Infant ADCC responses and ADCC sensitivity of the exposure strains associate with transmission.
ADCC sensitivity of TM and NTM viruses to (A) pool of maternal plasma and (B) bnAbs. (C) ADCC susceptibility correlation to maternal pool and bnAbs. Combined statistic of infant ADCCBP and sensitivity of TM and NTM strains to (D) maternal pool — ADCCAUC (maternal pool) — or (E) bnAbs — ADCCAUC (bnAb pool) — among HEI and HEU infants. (F) Neutralization susceptibility of TM and NTM Envs to maternal plasma pool and (G) combined statistic of infant NeutBP and neutralization susceptibility of the exposure strains. Colors signify matched pairs. Bars show mean and standard error. Group comparisons were done using Wilcoxon’s rank-sum test for A and B, Welch’s t test for D–G, and/or multivariable logistic regression for D, E, and G. Correlations were assessed using Spearman’s statistic. *P ≤ 0.05 with 1 of these statistical tests. All values are means from a minimum of 2 replicates.

