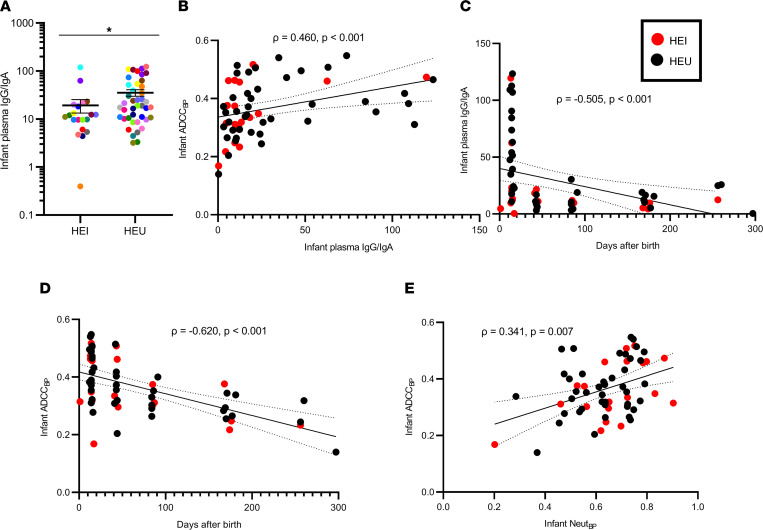
Figure 4. Predictors for infant plasma IgG/IgA and ADCCBP.
(A) Infant IgG/IgA ratio by transmission status. Colors signify matched pairs. Bars show mean and standard error. Comparison was done using Wilcoxon’s rank-sum test; *P ≤ 0.05. (B–E) Correlations among the variables identified in the x and y axis. The red and black dots indicate HEI and HEU infants, respectively. Correlations were assessed using Spearman’s statistic. Line indicates linear regression fit with 95% CI. All values represent mean values from a minimum of 2 replicates.

