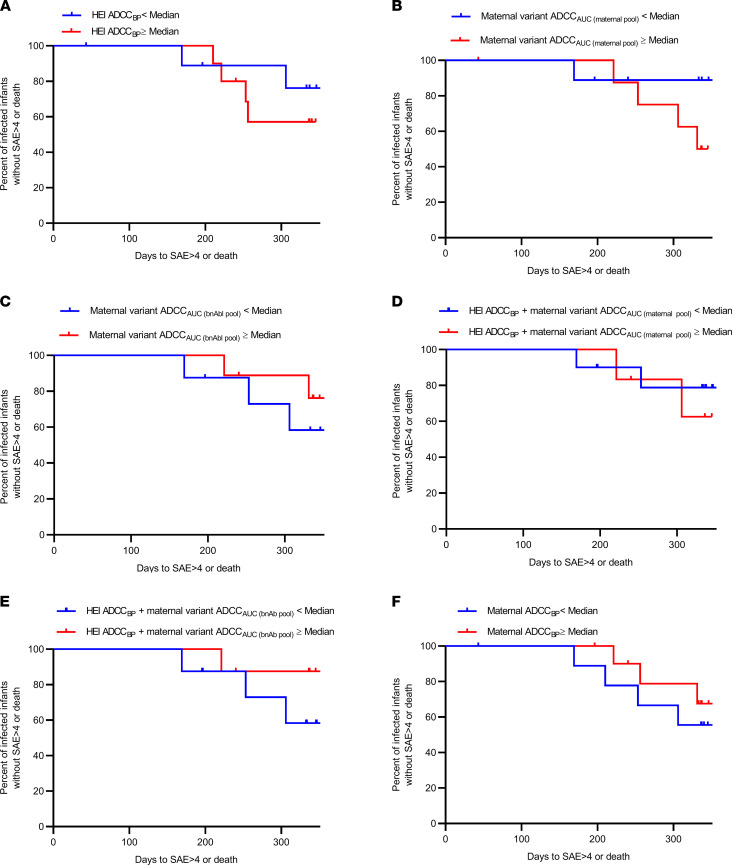
Figure 6. Morbidity associated with preexisting humoral responses.
Kaplan-Meier curves estimating time (days) to a grade 4 or greater serious adverse event or death for (A–E) HEI and (F) all infants with different measures greater than or equal to the cohort median (red) or less than the cohort median (blue). Tick marks denote right censoring.

