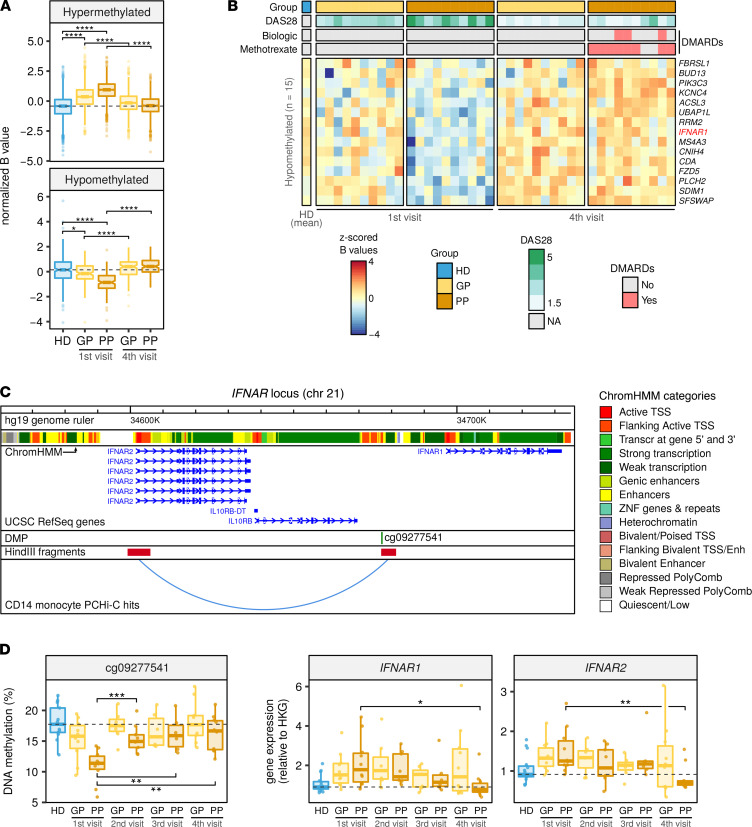
Figure 4. Evolution of DNA methylation profiles in subsequent visits.
(A) Box plots showing z-scored β values of DMPs between the first and fourth visits, by GP and PP, paired by patient and using DAS28 as a covariate (FDR < 0.05). (B) Heatmap of the DMPs in the hypomethylated cluster. Group, DAS28, and treatment are shown for every patient at the top, and the respective legend scales are shown to the right of the heatmap. Blue and red indicate lower and higher methylation, respectively. (C) IFNAR locus with PCHi-C interaction public data. (D) DNA methylation of cg09277541 (left panel) and gene expression of IFNAR1 and IFNAR2 (right panel) in visits 1–4, by prognosis group. DMP and interacting HindIII fragments are shown below a genome browser annotation of transcripts and MO ChromHMM tracks (see Methods). DNA methylation and gene expression from D were analyzed by bisulfite pyrosequencing and qRT-PCR, respectively. RPL38 was used as the HKG. The number of samples analyzed for each group in every time point is indicated in Supplemental Figure 1A. In A and D, each box represents the 25th to 75th percentiles. The lines inside the boxes represent the median. The lines outside the boxes represent the 25th percentile minus 1.5 times the IQR and the 75th percentile plus 1.5 times the IQR. Pairwise group differences were evaluated by 2-tailed Wilcoxon’s tests. *P < 0.05, **P < 0.01, ***P < 0.001, ****P < 0.0001.

