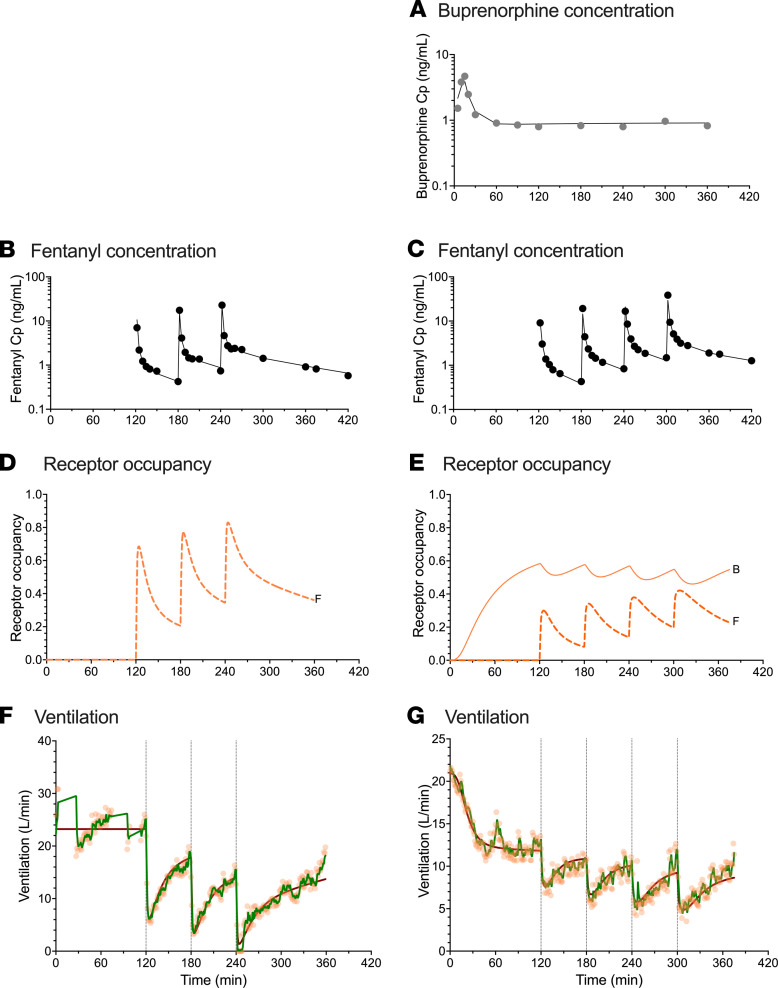
Figure 4. Example of data results and analyses of an individual with chronic opioid use.
Data fits and predicted receptor occupancy driving the effect of fentanyl (ascending doses of 0.25, 0.35, 0.50, and 0.70 mg/70 kg) on minute ventilation at the background of placebo infusion (B, D, and F) and low-dose buprenorphine infusion targeting a plasma concentration of 1 ng/mL (A, C, E, and G) in an individual with chronic opioid use. (A) Measured buprenorphine plasma concentration (Cp) (gray circles) and data fits (continuous line). (B and C) Measured fentanyl plasma concentration (Cp) (black circles) and data fits (continuous lines). (D and E) Predicted receptor occupancy for fentanyl (broken line, F) and buprenorphine (continuous line, B). (F and G) Measured ventilation (orange circles) and data fit of the model with a Kalman filter (green line) and data fit of the model without a Kalman filter (red line). Acquisition of ventilation data was sometimes interrupted for various reasons; in this case because the individual had to urinate (F).

