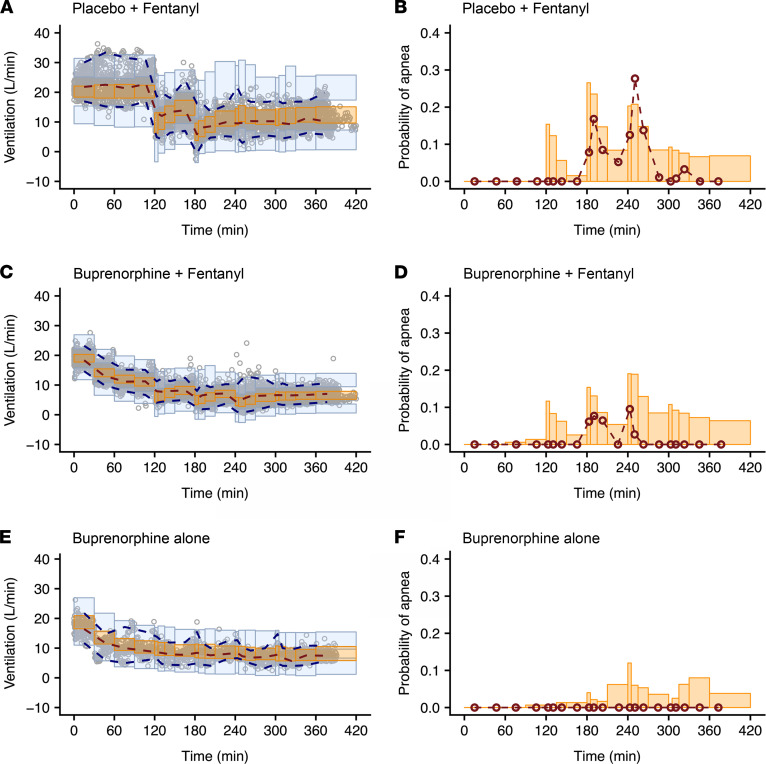
Figure 6. Prediction- and variability-corrected visual predictive checks of the pharmacodynamic model with a Kalman filter in opioid-naive individuals for the various drug administrations and probabilities of apnea for the same conditions.
(A and B) Fentanyl given at the background of placebo infusion. (C and D) Fentanyl given at the background of buprenorphine infusion. (E and F) Just buprenorphine. The dots in A, C, and E are the 1-minute ventilation averages; the broken lines are the observed percentiles (dark orange: median, dark blue: 2.5th and 97.5th percentiles); the bins are the 95% confidence intervals of simulated percentiles (orange bins: median, blue bins: 2.5th and 97.5th percentiles). The right panels (B, D, and F) give the probability of apnea. The red symbols are the probabilities of the observed apneic episodes; the orange bins are the simulated 95% confidence intervals of the probability of apnea.

