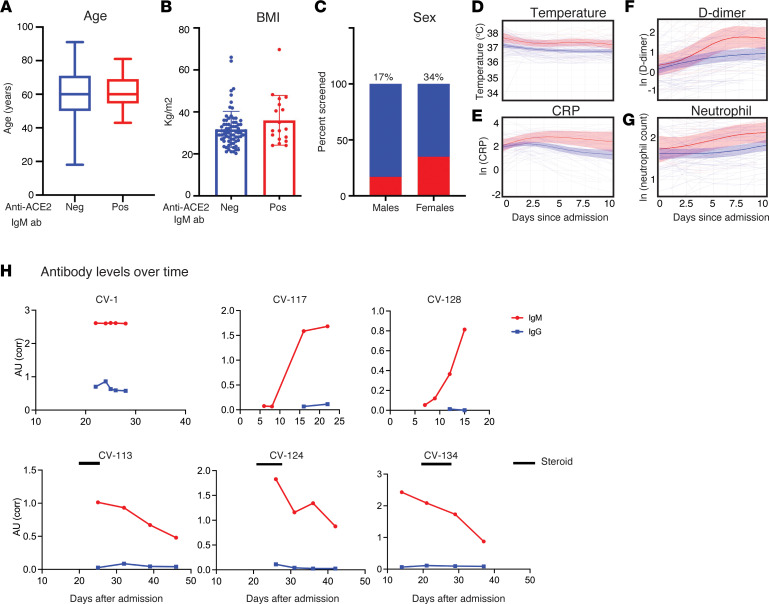
Figure 3. Clinical features of anti-ACE2 IgM–positive COVID-19 patients compared with those who do not have these antibodies.
(A) Age, (B) BMI, (C) sex, and levels of (D) temperature, (E) CRP, (F) D-dimer, and (G) neutrophils were compared between the anti-ACE2 IgM–positive and –negative COVID-19 patient groups. Red and blue colors denote anti-ACE2 IgM antibody–positive and –negative status, respectively. Box plots show median, 25th and 75th percentiles, and whiskers min to max. (D–G) Anti-ACE2 IgM-positive patients had higher average body temperature beginning early after hospital admission, followed by elevated CRP and D-dimer measurements. The IgM anti-ACE2–positive group had statistically significantly higher average temperatures, CRP, and D-dimer levels over the first 10 days of hospitalization than the IgM-negative group (P = 0.0001, 0.02, and 0.001, respectively). Average absolute neutrophil levels (G) were not statistically different between the 2 groups. Analyses in panels D–G use linear mixed effects model Wald test with 4 degrees of freedom (see Statistics). (H) Longitudinal analysis of anti-ACE2 IgM antibodies. For all those anti-ACE2 IgM–positive patients with multiple banked sera available (16/18), anti-ACE2 IgM and IgG antibodies were quantitated over time. Red and blue lines on each plot denote anti-ACE2 IgM and IgG antibodies, respectively. Solid black bars represent steroid treatment periods. Additional examples are shown in Supplemental Figure 4.

