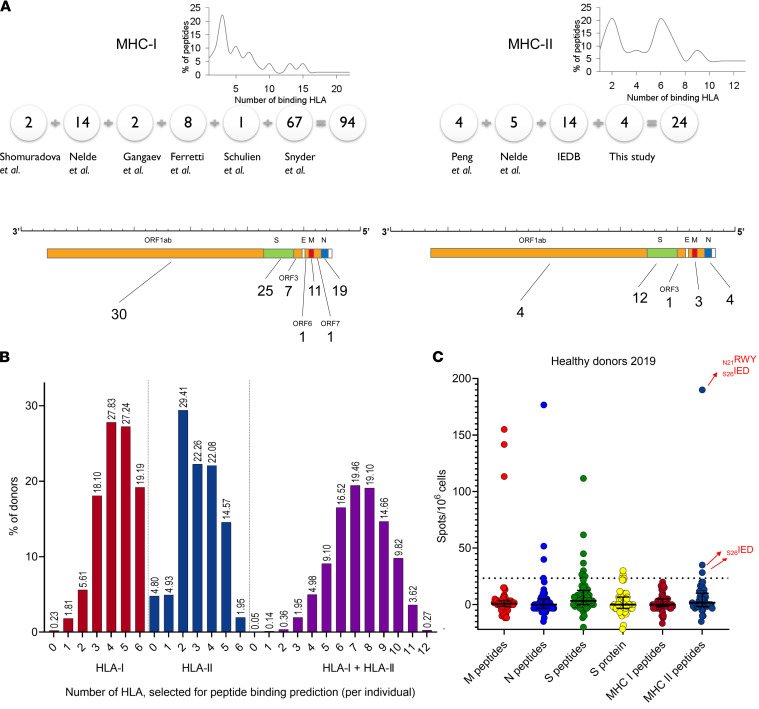
Figure 1. Characteristics of the peptide set.
(A) Number of epitopes selected from each indicated publication (detailed in Supplemental Table 1) for the MHC-I (left) and -II (right) sets. The distribution of the peptides according to the number of HLA that they bind is shown at top. The x axis displays the number of predicted binding alleles per peptide. The y axis shows the percentage of peptides that bind to a given number of alleles. Numbers below the SARS-CoV-2 genome schematic indicate the number of peptides derived from each gene. (B) The number of HLA class I (left) and -II (middle) alleles alone or in combination (right) that are predicted to bind at least 1 peptide from the set per individual among 2210 donors from the BM registry. (C) Antigen response among the healthy (HD-2019) cohort (n = 52). The normalized mean of 2 duplicate wells and the median and interquartile range. Cross-reactive MHC-II peptides are marked with red arrows. The positive threshold is indicated by the dotted line.

