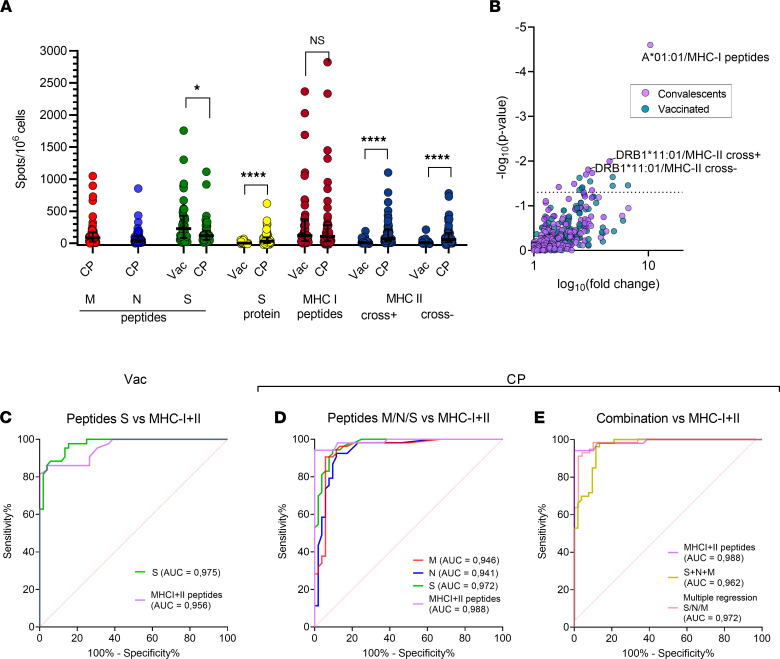
Figure 2. Response to MHC-II peptides differs significantly in Vac and CP donors.
(A) Response to the indicated antigens as measured by ELISpot for Vac (n = 43) and CP (n = 51). A normalized mean of 2 duplicate wells and a median with interquartile range. Mann-Whitney U test (S peptides, P = 0.013; MHC-II peptides, recombinant S protein, P < 0.0001). (B) Volcano plot shows the effect of a particular HLA allele on response to the same peptide sets and antigens. The x axis denotes the decimal logarithm of the ratio of the median response among HLA carriers to that of individuals without the HLA. The y axis denotes the negative decimal logarithm of the P value. The 3 most significant associations are annotated. P = 0.05 is depicted by the dotted line (Fisher’s exact test). (C–E) Receiver operating characteristic (ROC) curves for MHC I + II peptides versus S peptides in Vac versus HD-2019 samples (C); MHC I + II peptides versus S, N, or M peptides in CP versus HD-2019 samples (D); and MHC I + II peptides versus the sum of S, N, and M peptides and versus multiple regression model, incorporating S, N, and M peptides in CP versus HD-2019 samples (E). Three HD-2019 donors with cross-reactive responses were excluded from the ROC analysis for MHC I + II peptides.

