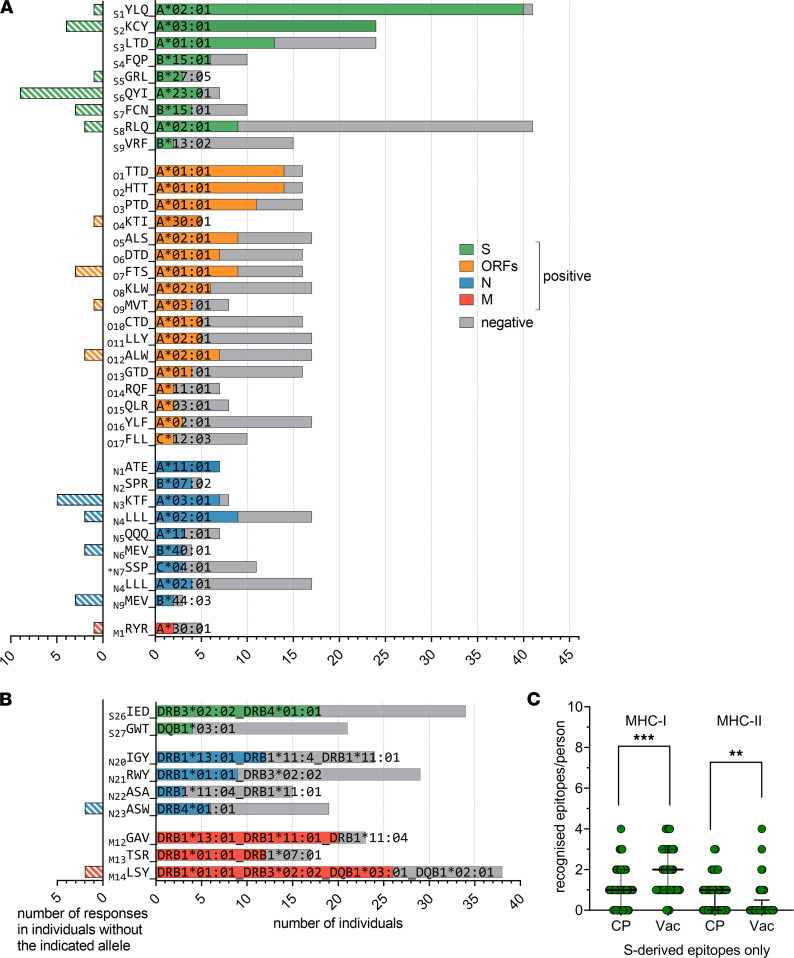
Figure 3. T cell response to MHC-I and MHC-II epitopes in CP and Vac.
(A and B) Immunogenicity in carriers of various HLA-I (A) or HLA-II (B) alleles. For the right sides of the plots, gray bars indicate the number of tested carriers; colored bars indicate the number of responses. Colors indicate source protein, with 3-letter amino acid codes at left. Superscript numbers indicate peptide length, and the asterisk denotes a peptide with an ambiguous HLA association. The left sides of the plots show the number of responses in donors without the indicated HLA. For HLA-I, the association between the response and a single HLA allele is shown; for HLA-II, the best associations (including associations with several HLAs) are shown. Fisher’s exact test; P < 0.05 were considered significant (exact P values are specified in Supplemental Table 3). (C) Number of S protein–derived MHC-I and MHC-II epitopes recognized per individual for the CP and Vac cohorts; median and interquartile range are shown

