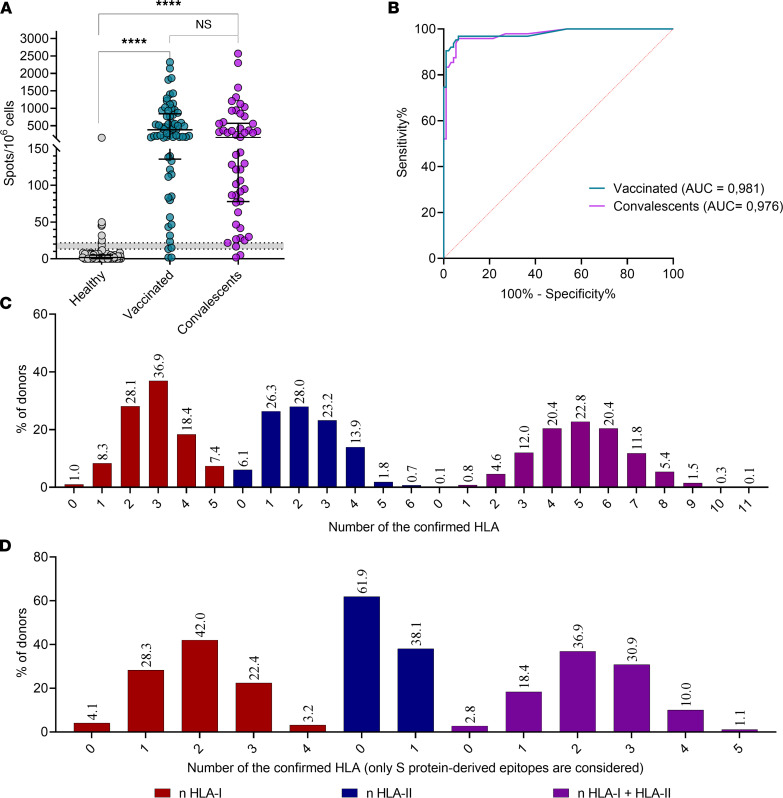
Figure 4. Clinical trial confirmed the high accuracy of the Corona-T-test in discriminating healthy donors from vaccinated and convalescents.
(A) Scatter plot shows Corona-T-test result. A normalized mean of 2 duplicate wells for the Vac_trial (n = 69) and CP_trial (n = 50) and HD-2021 (n = 95) cohort with median and interquartile range. Results in the gray zone (n = 6) were excluded from the ROC-analysis. Kruskal-Wallis with Dunn’s post hoc test; ****P < 0.0001. (B) ROC curve for Vac_trial (AUC = 0.98) an CP_trial (AUC = 0.97) versus HD-2021_trial. (C and D) Number of confirmed HLA-I and -II alleles per individual binding at least 1 peptide from any protein (C) or S protein (D) (n = 2210).

