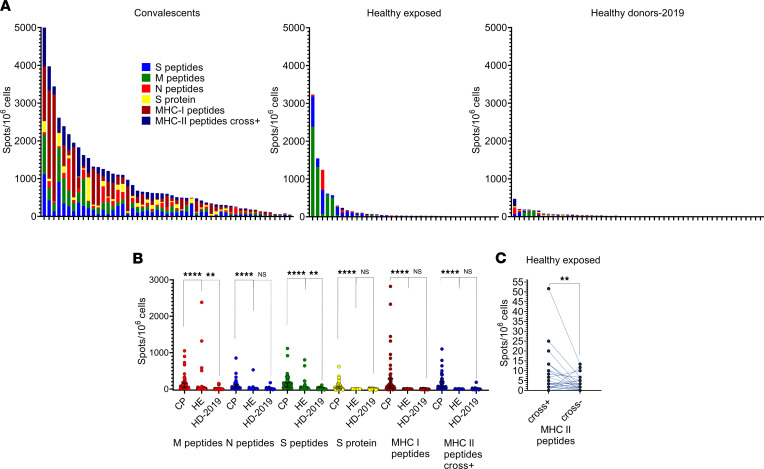
Figure 5. Evidence for a cross-reactive rather than SARS-CoV-2–specific response in the healthy exposed (HE) cohort.
(A) Response to the antigens (normalized mean of 2 wells after subtracting negative control) in HE (n = 37), CP (n = 51), and HD-2019 (n = 52) cohorts. Each bar represents an individual donor; colors represent particular antigens. (B) Comparison of the response to antigens between cohorts as measured with ELISpot. A normalized mean of 2 duplicate well, and the median response and interquartile range. Kruskal-Wallis with Dunn’s post hoc test; ****P < 0.0001, **P < 0.01. (C) Difference in responses to MHC-II peptides before and after exclusion of 2 cross-reactive peptides in the HE cohort (Wilcoxon test; P = 0.0045).**P < 0.01.

