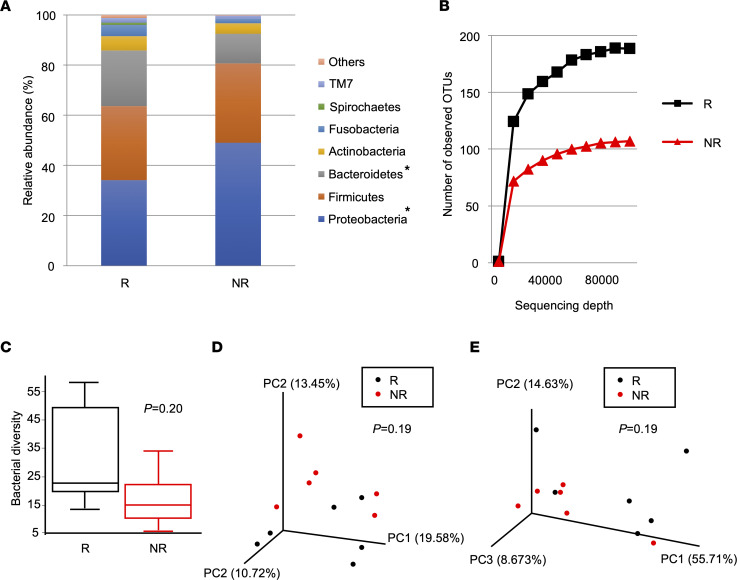
Figure 2. Respiratory microbial diversity was reduced in nonresponders compared with responders.
(A) Respiratory microbial composition at the phylum level based on the relative abundance of operational taxonomic units (OTUs) for the BALF samples. P values were calculated using unpaired t test. *P < 0.05. (B and C) Alpha diversity analysis of the respiratory microbiome. (B) Rarefaction curve using the number of OTUs. (C) Bacterial alpha diversity based on Faith’s phylogenetic alpha diversity index. P values were calculated using the Kruskal-Wallis test. (D and E) Principal coordinate analysis of (D) the unweighted UniFrac distance matrices and (E) the weighted UniFrac distance matrices for the microbial communities. P values were calculated using the permutational multivariate ANOVA test. Responders (R; black), n = 6. Nonresponders (NR; red), n = 6.

