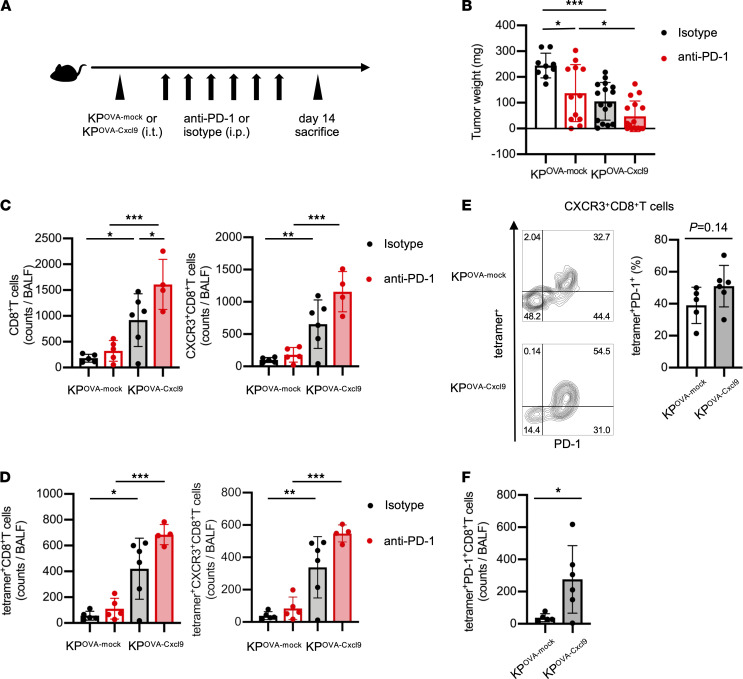
Figure 4. Overexpression of CXCL9 in KPOVA enhanced recruitment of tumor-specific CXCR3+CD8+ T cells and reduced tumor growth.
(A) Schematic of treatment schedule. Mice were inoculated with 1 × 10⁶ KPOVA cells transfected with empty vector (mock) or with KPOVA-Cxcl9 cells. Then, they were treated with either anti–PD-1 antibodies or isotype control for 2 weeks starting 3 days after tumor inoculation. BALF and tumors were collected after sacrifice on day 14. (B) Tumor weight of mice inoculated with KPOVA-mock or KPOVA-Cxcl9 cells and treated with isotype (black) or anti–PD-1 (red). Tumor weight encompasses the total weight of the tumor enucleated from the lung tissue and tumors invading the mediastinum and chest wall. Data are presented as the mean ± SEM. *P < 0.05, *** P < 0.001; statistical significance determined by 1-way ANOVA with Tukey’s multiple comparison test (n = 9–16 mice/group). (C and D) Total counts of (C) CD8+ and CXCR3+CD8+ T cells and (D) tetramer+ and tetramer+CXCR3+CD8+ T cells in BALF were analyzed by flow cytometry. BALF was collected from mice inoculated with KPOVA-mock or KPOVA-Cxcl9 cells and treated with isotype (black) or anti–PD-1 (red). Data are presented as the mean ± SEM. *P < 0.05, ** P < 0.01, ***P < 0.001; statistical significance determined by 1-way ANOVA with Tukey’s multiple comparison test (n = 4–6 mice/group). (E) Representative contour plots and summary of the frequency of OVA-tetramer+PD-1+ subsets in CXCR3+CD8+ T cells compared between mice inoculated with KPOVA-mock or KPOVA-Cxcl9 cells and treated with isotype control. Data are presented as the mean ± SEM. Statistical significance determined by Student’s t test (n = 5–6 mice/group). (F) Summary of the total counts of OVA-tetramer+PD-1+CD8+ T cells in BALF compared between mice inoculated with KPOVA-mock or KPOVA-Cxcl9 and treated with isotype control. Data are presented as the mean ± SEM. *P < 0.05; statistical significance determined by Student’s t test (n = 5–6 mice/group). (B–F) Data are representative of at least 2 independent experiments.

