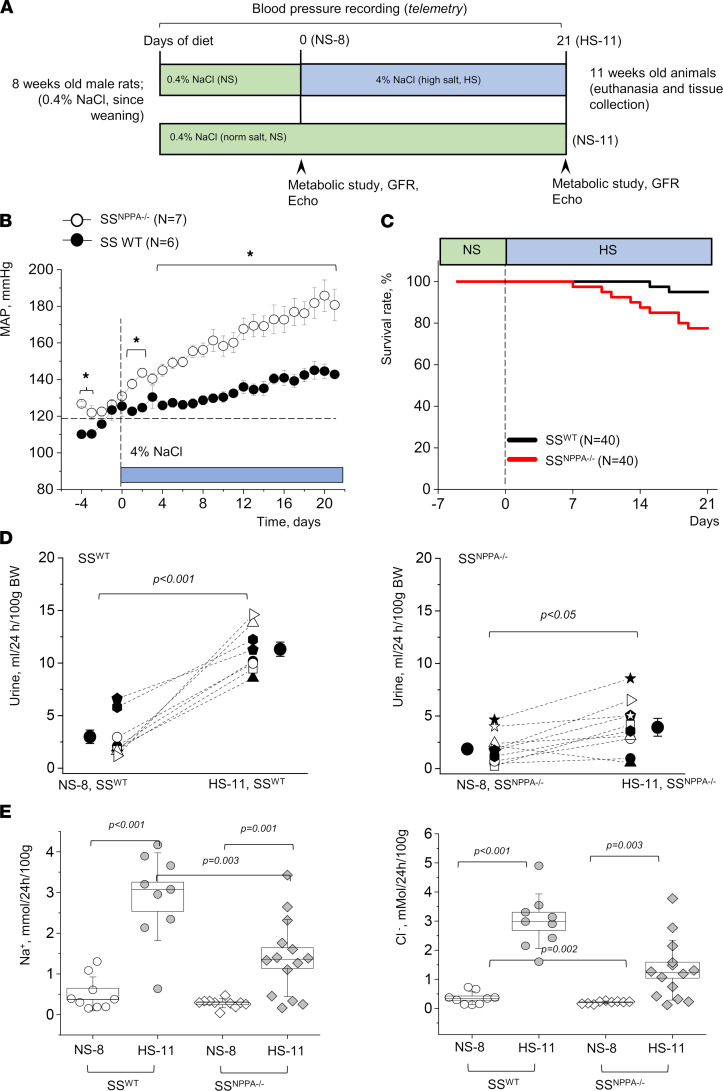
Figure 3. Male SSNPPA–/– rats fed a HS diet exhibit higher blood pressure, reduced urine flow, and lower Na+ and Cl– excretion than SSWT.
(A) Schematic representation of the experimental protocol. (B) Mean arterial pressure (MAP) recorded via telemetry in SSWT (n = 6) versus SSNPPA–/– (n = 7) rats throughout the experimental protocol. *P < 0.05. (C) Survival rates of SSWT versus SSNPPA–/– rats during a HS diet challenge. (D) Urine flow in the 8- and 11-week-old animals (before and after starting the HS challenge). n = 9 for SSWT, n = 10 for the SSNPPA–/– group. (E) Electrolyte excretion (Na+ and Cl–) in the 11-week-old animals (after NS since weaning, or NS until 8 weeks of age, and 3 weeks on HS, as shown in A). n = 9 for SSWT, n = 14 for the SSNPPA–/– group. P values are shown on the graphs. NS-8 and NS-11 refer to 8- or 11-week-old animals fed NS since weaning, and HS-11 refers to 11-week-old animals fed a HS diet from week 8 until week 11. Data were analyzed with 2-way ANOVA (E), paired t test (D), log-rank test (C), or repeated-measures ANOVA (B), as appropriate. Male animals were used.

