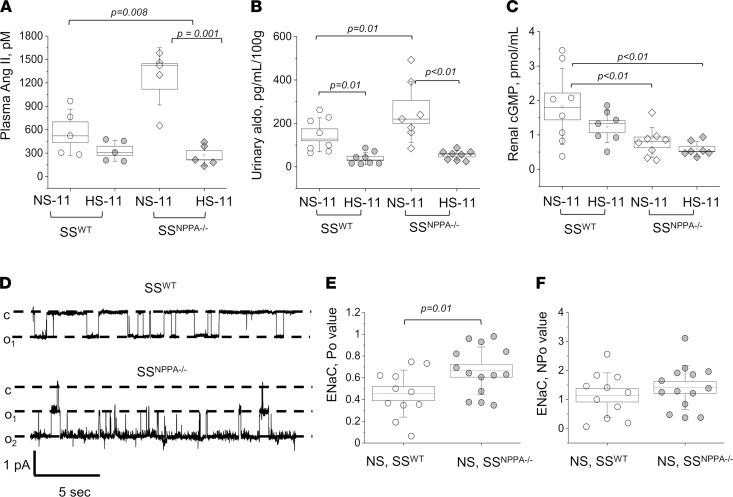
Figure 8. RAAS levels, cGMP concentration and ENaC activity in the SSNPPA–/– rats.
(A) Plasma level of Angiotensin II (Ang II) in the 11-week-old SSWT rats on NS and HS, and SSNPPA–/– rats on NS and HS. n = 5 samples obtained from individual rats, for all groups. (B) Urinary aldosterone excretion (normalized to daily urine flow) in the 11-week-old SSWT rats on NS and HS, and SSNPPA–/– rats on NS and HS. n = 8, 8, 7, 8 samples obtained from individual rats. (C) cGMP level in the renal tissues of the 11-week-old SSWT rats on NS and HS, and SSNPPA–/– rats on NS and HS. n = 8, 7, 8, 7 tissue samples obtained from individual rats. Data in A–C were analyzed with 2-way ANOVA followed by a Holm-Sidak post hoc test; if significant, P values are shown on the graphs. (D) Representative single-channel traces for ENaC activity recorded in freshly isolated split opened CCDs from 11-week-old SSWT and SSNPPA–/– rats. Patches were held at the test potential of Vh= −Vp= –40 mV. Inward Li+ currents are downward. The closed and open states of the channel are denoted by c and oi, respectively. (E and F) Summarized single-channel open probability (Po) and NPo of the recorded ENaC channels. In E and F, data was analyzed with a 2-tailed t test; if significant, P values are shown on the graphs. n = 7 individual rats per group; n = 11 and 14 recordings obtained in SSWT and SSNPPA–/– rats on NS, respectively. Male animals were used.

