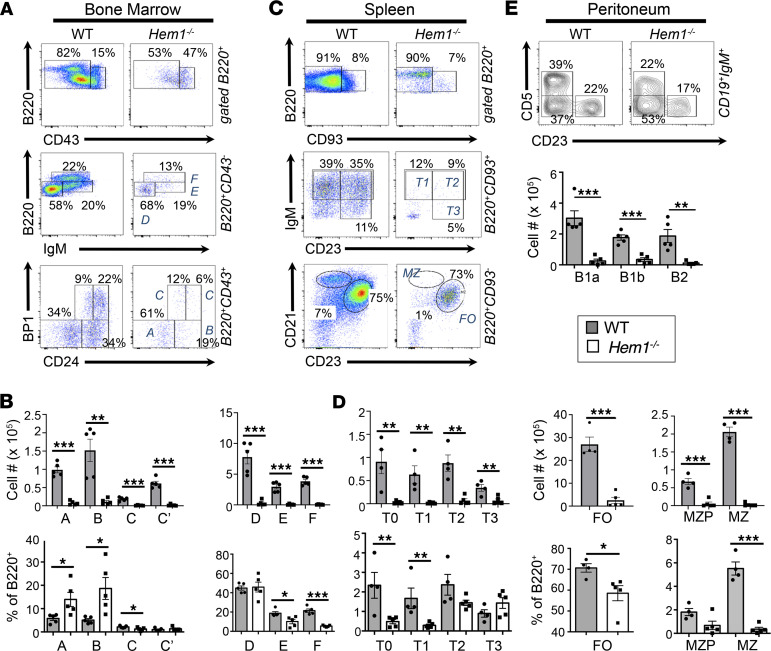
Figure 1. Constitutive disruption of Hem-1 results in impaired B cell development.
BM cells, splenocytes, and peritoneal cells were isolated from 6- to 12 week-old Hem1–/– and littermate control mice. Cells were stained with the indicated fluorescent conjugated antibodies followed by flow cytometric analyses. (A) Representative flow cytometric dot plot histograms. (B) Bar graphs and quantification of B cell populations (Hardy fractions A–F) in BM cells. (C) Representative dot plot histograms. (D) Bar graphs with quantification of B cell populations (T0-T3 MZ, FO, MZP, and MZ) isolated from spleens. (E) Representative flow cytometric contour histograms and bar graphs showing quantification of B1 and B2 B cells isolated from the peritoneal cavities. Data are representative of ≥ 5 experiments with WT and Hem1–/– mice (n ≥ 10 mice per group). Each data point represents an individual mouse, and the graphs are derived from independent experiments. Data represent mean ± SEM and were analyzed via unpaired Student’s t test. *P < 0.05, **P < 0.01, ***P < 0.001.

