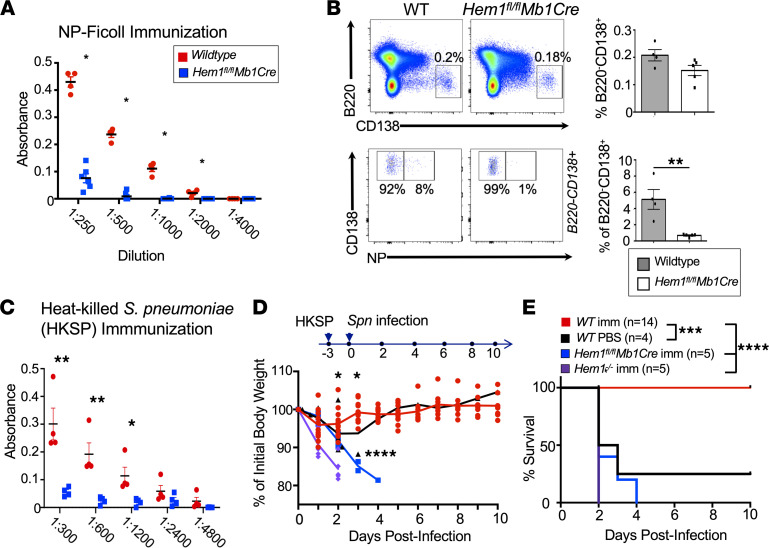
Figure 5. Hem-1 is required for optimal TI Ab production and protection against Streptococcus pneumoniae challenge.
(A and B) WT and Hem1fl/flMb1Cre mice (n = 4 and n = 5) were immunized with 50 μg/mL NP-Ficoll. (A) ELISA plates were coated with NP-BSA30 (10 μg/mL), and Ab production was measured 6 days after immunization. Shown is a graph depicting absorbance at 405 nm versus serum dilution. (B) BM was harvested from immunized mice 6 days after immunization. Cells were stained for fluorescent conjugated antibodies against the indicated markers for flow cytometric analyses. Shown are representative dot plot histograms and bar graphs quantifying the percentages of total plasma cells (B220–CD138+) (top) and NP-specific plasma cells (bottom). Each data point is representative of an individual mouse, and data were derived from a single experiment. (C) ELISA plates were coated with 50 μg/mL PC-BSA and used to determined IgM production 5 days after i.v. immunization with 1 × 10⁷ cfu heat-killed Streptococcus pneumoniae (HKSP). Shown are graphs depicting the absorbance at 405 nm versus serum dilution. (D and E) WT, Hem1–/–, and Hem1fl/flMb1Cre mice (n = 14, 5, and 5) were immunized with HKSP. Immunized (imm) mice, and unimmunized WT control mice (n = 4), were challenged with 1 × 10⁷ cfu live Spn and were monitored daily. (D) A graph depicting BW loss versus days after infection. (E) A Kaplan-Meier survival curve for each group. Data points represent individual mice, and data were combined from 2 independent experiments. Data represent mean ± SEM and were analyzed via unpaired Student’s t test (A–C) or the Gehan-Breslow-Wilcoxon test using GraphPad prism (E). Shown are individual comparisons. For multiple comparisons using ANOVA, P < 0.0001. *P < 0.05, **P < 0.01, ***P < 0.001, ****P < 0.0001.

