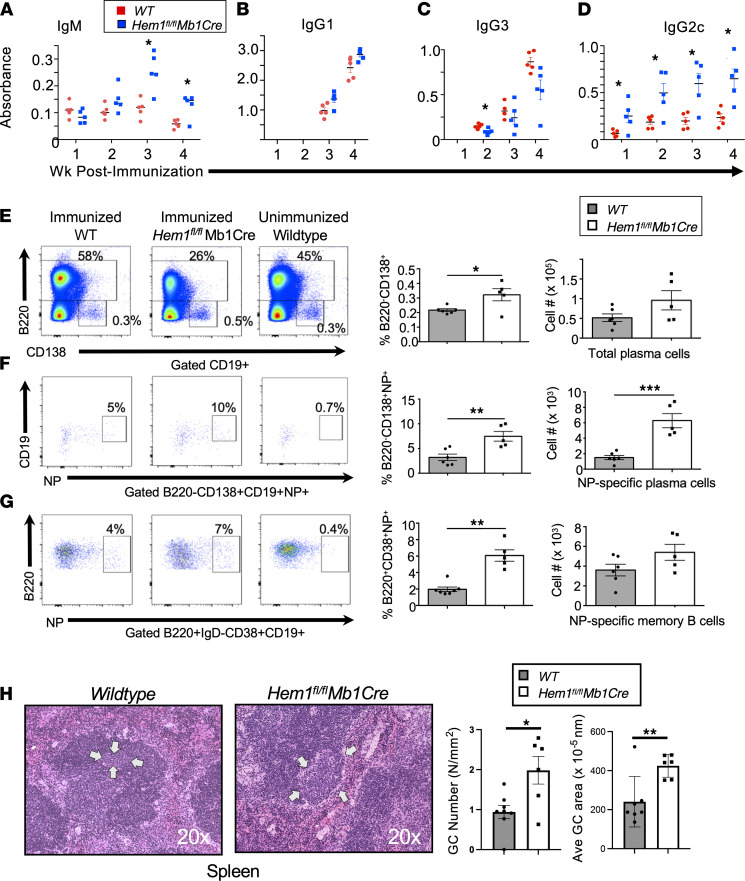
Figure 6. Conditional deletion of Hem-1 in B cells results in increased IgM and IgG2c Ab production in response to immunization with TD Ags.
Eight- to 10-week-old mice were immunized with 100 μg/mouse NP-KLH in alum via i.p. injection. (A–D) Shown are graphs depicting NP-specific IgM, IgG1, IgG3, and IgG2c production based on OD at 405 nm over a 4-week period after immunization. n = 5 mice per group. Each data point represents a single mouse and is representative of a single experiment. Data represent mean ± SEM and were analyzed via unpaired Student’s t test. *P < 0.05. (E–G) WT and Hem1fl/flMb1Cre mice were immunized with NP-KLH. Four weeks after immunization, mice were boosted with 20 μg/mouse NP-KLH in PBS. Seven days after boost, splenocytes were harvested and cells were stained for flow cytometric analyses. (E) Shown are representative dot plot histograms (left) and graphs with quantification of total plasma cells (B220–CD138+) (right) isolated from immunized WT and Hem1fl/flMb1Cre mice and unimmunized control mice. (F) Shown are representative dot plot histograms (left) and quantification of NP-specific plasma cells (B220–CD138+CD19–NP+) (right) from immunized WT and Hem1fl/flMb1Cre mice and unimmunized control mice. (G) Representative flow cytometric histograms and graphs with quantification of memory B cells (B220+IgD–CD38+CD19+NP+) from immunized WT, and Hem1fl/flMb1Cre mice and unimmunized control mice. (H) H&E-stained spleen sections from individual mice showing germinal center size (20× magnification) (left) and bar graphs depicting GC number/area and average GC area (right). Arrows denote the size of representative GCs. Each data point is representative of an individual mouse and is representative of a single experiment. Data represent mean ± SEM and were analyzed via unpaired Student’s t test. *P < 0.05, **P < 0.01, ***P < 0.001.

