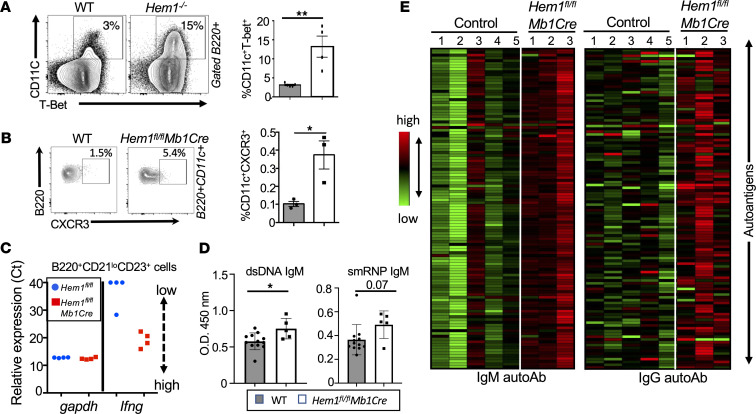
Figure 7. B cell–specific disruption of Hem-1 results in increased autoantibody production and a higher proportion of CD11c+T-bet+ ABC cells.
(A and B) Representative flow cytometric contour histograms and graphical representation of B220+CD11c+T-bet+ splenic B cells from WT and Hem1–/– mice, and B220+CD11c+CXCR3+ B cells from WT and Hem1fl/flMb1Cre mice. (C) Real-time PCR dot plots showing gapdh (loading control) and Ifng gene expression (Ct) from B220+CD21loCD23+ B cells sorted by FACS from WT (blue dots) and Hem1fl/flMb1Cre (red squares) mice and then stimulated for 12 hours with 10 μg/mL anti-IgM and 20 U/mL IFN-γ. Relative gene expression increases as Ct decreases. (D) Sera were collected from M and F mice ages 13–28 weeks. Shown are graphs depicting isotype-specific anti-dsDNA and anti-smRNP autoantibodies as determined by ELISA. Each data point represents an individual mouse, and the data were collected from a single experiment. (E) Sera were collected from female Hem1fl/flMb1Cre and control mice ages 28–32 weeks. Sera were then hybridized to an autoantigen microarray containing 128 antigens. Shown are heatmaps depicting antigen reactivity (antibody score) for IgM (left) and IgG (right). Statistically significant changes in female mice are noted in Supplemental Figure 7. Data represent mean ± SEM and were analyzed via unpaired Student’s t test or paired Student’s t test. *P ≤ 0.05, **P ≤ 0.01, ***P ≤ 0.001.

