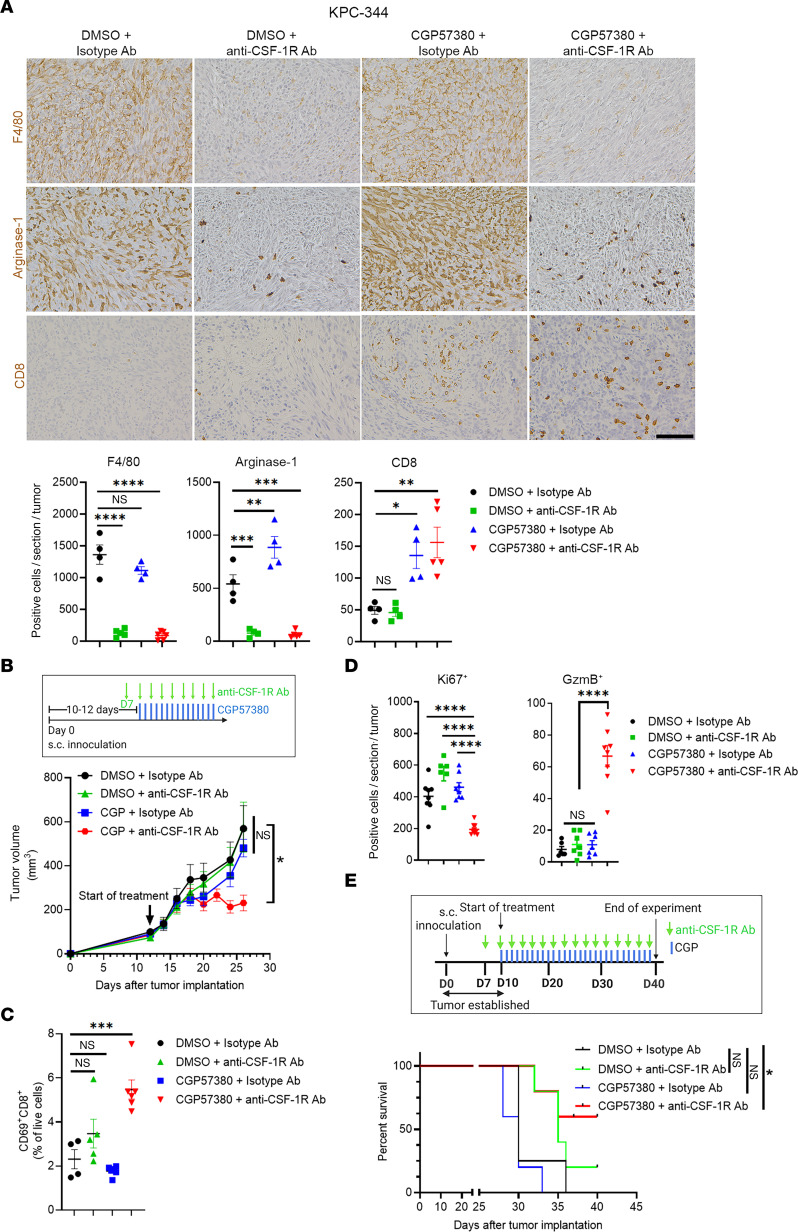
Figure 8. Macrophage depletion in combination with MNK inhibitors activates CD8+ T cells and suppresses tumor growth in vivo.
Established KPC-344 tumors were treated with CGP57380 (CGP, 25 mg/kg, daily) or DMSO (vehicle control) in combination with either an anti–CSF-1R antibody (300 μg, day –3, day 0, and subsequently in an every-other-day pattern) or a control isotype-matched IgG antibody. (A) The tumors at the study endpoint were stained for F4/80, Arginase-1, and CD8 by IHC. Scale bar: 100 μm. The absolute number of positive cells per 20× field was quantified by ImageJ and analyzed by GraphPad. (B and C) KPC-344 tumor volume was measured by caliper and calculated using the formula V = (W2 × L)/2. Isolated CD8+ T cells from tumors collected at the study endpoint were analyzed for CD69 expression by flow cytometry. (D) Tumors were stained by IHC for Ki67 and granzyme B (GzmB). The number of positive cells per 10× field was quantified by ImageJ and analyzed by GraphPad. Data points in A–D represent individual tumors. (E) The effect of different treatments on the overall survival of tumor-bearing mice was determined as described in Methods. Log-ranked (Mantel-Cox) test for survival analysis was performed by GraphPad. Data in A–D are shown as the mean ± SEM, and analysis was done using 1-way ANOVA followed by Dunnett’s multiple comparison test. *P < 0.05; **P < 0.01; ***P < 0.001; ****P < 0.0001.

