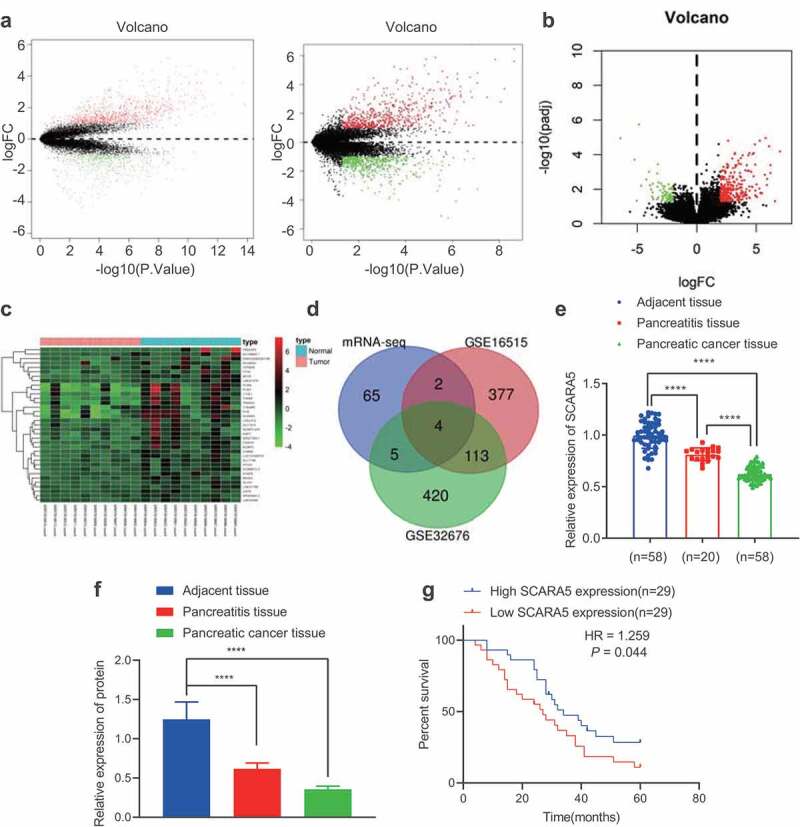
Figure 2.

SCARA5 is poorly expressed in PC.
A. The volcano plot of mRNA expression from GSE16515 and GSE32767 PC expression datasets. The black dot indicates mRNAs without significant difference, the green dot represents significantly downregulated mRNAs, and the red dot shows significantly upregulated mRNAs in PC. B. The volcano plot of mRNA expression sequencing data obtained from SRA database, the black dot indicates mRNAs without significant difference. The green dot represents significantly downregulated mRNAs, and the red dot shows significantly upregulated mRNAs in PC. C. A heat map of differential analysis to show the top 35 most significantly downregulated mRNAs in PC. The x-axis presents the sample number and the y-axis indicates the mRNAs. Each small square in the figure indicates the expression of an mRNA in a sample. D. Intersected significantly downregulated mRNAs in PC obtained from SRA database and from GSE16515 and GSE32767 PC expression datasets. Blue circle indicates significantly downregulated genes via differential analysis of PC transcriptomic sequencing data, red circle indicates significantly downregulated genes via differential analysis of PC GSE16515 expression dataset, and green circle indicates significantly downregulated genes via differential analysis of PC GSE32676 expression dataset. The overlay represents the intersection of the three sets of data. E. The expression of SCARA5 in PC tissues, adjacent normal tissues, and pancreatitis tissues determined by RT-qPCR. F. The protein expression of SCARA5 in PC tissues, adjacent normal tissues, and pancreatitis tissues determined by Western blot analysis. G. Kaplan–Meier curve analysis of the correlation between SCARA5 expression and the overall survival of PC patients.
