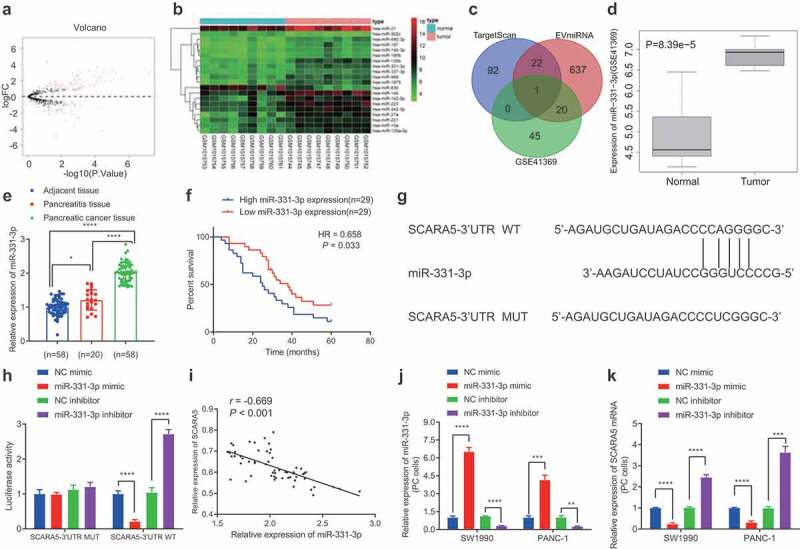
Figure 3.

miR-331-3p targets SCARA5 in PC cells.
A. The volcano plot of miRNA expression from GSE41369 PC expression dataset. The black dot indicates miRNAs without significant difference, the green dot represents significantly downregulated miRNAs, and the red dot shows significantly upregulated miRNAs in PC. B. Heat maps of differential analysis from GSE41369 PC expression datasets to show the top 20 most significantly upregulated miRNAs. The x-axis presents the sample number and the y-axis indicates the miRNAs. Each small square in the figure indicates the expression of a miRNA in a sample. C. Prediction of upstream miRNAs of SCARA5. The three ellipses in the figure represent the prediction results of miRNAs from TargetScan and miRNAs in human fibroblast EVs from EVmiRNA database and significantly upregulated miRNAs in PC miRNA expression dataset GSE41369. The overlay represents the intersection of the three sets of data. D. The expression of miR-331-3p in PC expression dataset GSE41369. E. The expression of miR-331-3p in PC, corresponding to healthy and pancreatitis tissues. F. Kaplan–Meier analysis of the relationship between the survival of 58 PC patients and expression of miR-331-3p. G. The binding sites between SCARA5 and miR-331-3p predicted by TargetScan. H. Dual-luciferase reporter assay to assess the binding of miR-331-3p to SCARA5. I. Pearson’s correlation coefficient analysis of the association between miR-331-3p and SCARA5 expression in 58 PC tissues. J. Expression miR-331-3p in SW1990 and PANC-1 cells after transfection determined by RT-qPCR. K. Expression of SCARA5 in SW1990 and PANC-1 cells after transfection determined by RT-qPCR. Experiments were repeated 3 times. * indicates p < .05 and *** indicates p < .001.
