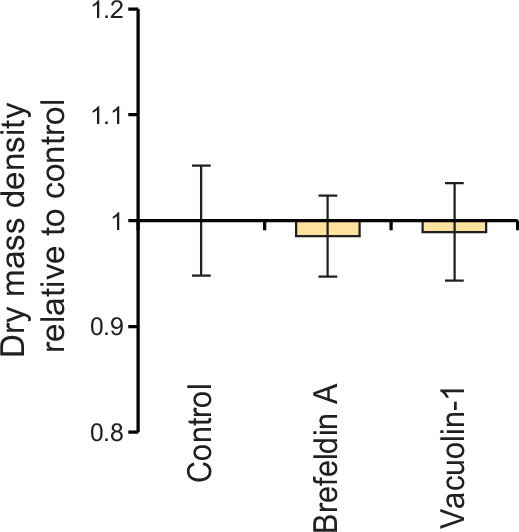
Figure 6. Inhibitors of lysosomal exocytosis decrease mitotic dry mass secretion.
(A) Representative histograms (left) and quantifications (right) of live L1210 cell surface LAMP-1 immunolabeling following indicated, 4 hr long chemical treatments. Line and whiskers indicate mean ± SD; N = 4–7 independent cultures. (B) Normalized dry mass behavior for FUCCI L1210 cells treated with indicated chemicals (left) and quantifications of early mitotic dry mass changes (right). N = 36 cells from 13 independent experiments for control; N = 17 cells from 17 independent experiments for brefeldin A; N = 19 cells from 19 independent experiments for vacuolin-1; p-values calculated using ANOVA followed by Sidakholm post hoc test; Thick line and shaded area represent mean ± SD; boxplot line: mean; box: interquartile range; whiskers: 5–95% range. (C) Same as panel (B), but for dry mass density. Raw data can be found in Figure 3—source data 1.
Figure 6—figure supplement 1. L1210 cell population dry mass density following exocytosis perturbations.


