. 2022 Apr 19;11:e76021. doi: 10.7554/eLife.76021

Figure 6. High levels of dithiothreitol (DTT) cause toxicity via the methionine–homocysteine cycle and ER proteotoxic stress.

(A) Representative fluorescence images of hsp-4p::GFP animals grown on E. coli OP50 diet containing 0 mM DTT until the young adult stage, followed by incubation on E. coli OP50 diet containing 0, 10, and 10 mM DTT supplemented with 50 nM vitamin B12, 10 mM DTT supplemented with 25 mM methionine, and 10 mM DTT supplemented with 80 mM choline for 24 hr. Scale bar = 200 µm. (B) Quantification of GFP levels of hsp-4p::GFP animals grown on E. coli OP50 diet containing 0 mM DTT until the young adult stage, followed by incubation on E. coli OP50 diet containing 0, 10, 10 mM DTT supplemented with 50 nM vitamin B12, 10 mM DTT supplemented with 25 mM methionine, and 10 mM DTT supplemented with 80 mM choline for 24 hr. ***p < 0.001 via the t-test. n.s., nonsignificant (n = 16 worms each). Quantification of different developmental stages of N2 (C), ire-1(v33) (D), xbp-1(tm2482) (E), atf-6(ok551) (F), and pek-1(ok275) (G) animals on various concentrations of DTT on E. coli OP50 diet. The ire-1(v33) animals were grown for 84 hr while all other animals were grown for 72 hr at 20°C (n = 3 biological replicates; animals per condition per replicate >80). Quantification of development of N2 (H), ire-1(v33) (I), and xbp-1(tm2482) (J) animals on E. coli OP50 plates containing 0, 5, and 5 mM DTT supplemented with 50 nM vitamin B12, 10 mM DTT, and 10 mM DTT supplemented with 50 nM vitamin B12 (n = 3 biological replicates; animals per condition per replicate >80).

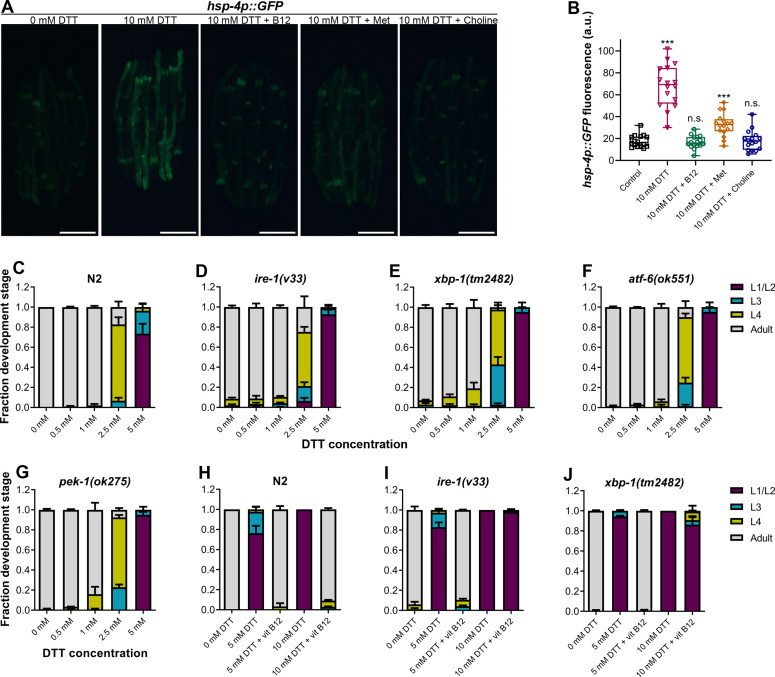
Figure 6—source data 1. High levels of dithiothreitol (DTT) cause toxicity via the methionine–homocysteine cycle and ER proteotoxic stress.

Figure 6.

Figure 6—figure supplement 1. The ATF-6 and PEK-1 pathways are not involved in combating dithiothreitol (DTT) toxicity.

Figure 6—figure supplement 1.

(A) Representative fluorescence images of hsp-4p::GFP animals grown on E. coli OP50 diet containing 0 mM DTT until the young adult stage, followed by incubation on E. coli OP50 diet containing 0, 5, and 10 mM DTT for 24 hr. Scale bar = 200 µm. (B) Quantification of GFP levels of hsp-4p::GFP animals grown on E. coli OP50 diet containing 0 mM DTT until the young adult stage, followed by incubation on E. coli OP50 diet containing 0, 5, and 10 mM DTT for 24 hr. The 0 and 10 mM DTT data are the same as in Figure 6B. ***p < 0.001 and **p < 0.01 via the t-test (n = 16 worms each). (C) Representative images of N2, atf-6(ok551), and pek-1(ok275) animals on E. coli OP50 plates containing 0, 5, 5 mM DTT supplemented with 50 nM vitamin B12, 10 mM DTT, and 10 mM DTT supplemented with 50 nM vitamin B12. Scale bar = 1 mm. Quantification of different developmental stages of N2 (D), atf-6(ok551) (E), and pek-1(ok275) (F) animals on E. coli OP50 plates containing 0, 5, and 5 mM DTT supplemented with 50 nM vitamin B12, 10 mM DTT, and 10 mM DTT supplemented with 50 nM vitamin B12 (n = 3 biological replicates; animals per condition per replicate >80).
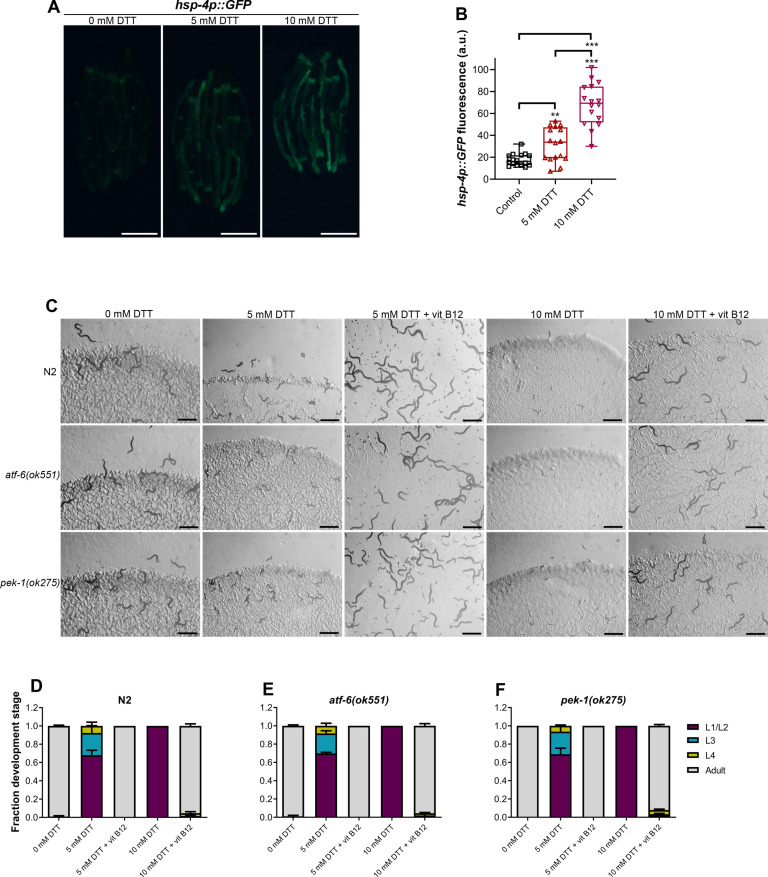
Figure 6—figure supplement 1—source data 1. The ATF-6 and PEK-1 pathways are not involved in combating dithiothreitol (DTT) toxicity.
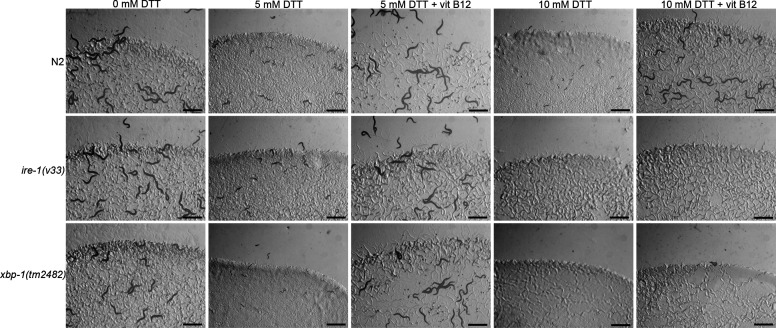
Figure 6—figure supplement 2. Counteracting high, but not low, levels of dithiothreitol (DTT) requires a functional IRE-1/XBP-1 unfolded protein response (UPR) pathway.

Figure 6—figure supplement 2.

Representative images of N2, ire-1(v33), and xbp-1(tm2482) animals on E. coli OP50 plates containing 0, 5, and 5 mM DTT supplemented with 50 nM vitamin B12, 10 mM DTT, and 10 mM DTT supplemented with 50 nM vitamin B12. Scale bar = 1 mm.