. 2022 May 10;11:e73405. doi: 10.7554/eLife.73405

Figure 2. Wavelength dependency of phototaxis via optical microscopy.

(A) Schematics of the lateral illumination for phototaxis. Five LEDs were simultaneously applied through dichroic mirrors from the right side. (B) Spectra of lateral and vertical light for phototaxis. (C) Effects of the monochromatic light source on the phototactic behaviour of cells on a glass surface. (D) Effects of dichromatic light source on the phototactic behaviour of cells over the glass surface. Each lateral light was used at a fluence rate of 70 μmol m−2 s−1. The average and standard deviation (SD) of the cell displacement along the light axis are presented (N = 50). (E) Rose plots under green light at 70 μmol m−2 s−1 (upper) and green and blue light at 70 μmol m−2 s−1 (lower). The moving direction of a cell that translocated more than 6 μm min−1 was counted. Angle 0 was the direction towards the lateral light source (N = 50 cells). (F) On–off control of phototaxis. A kymogram of cell movements along the optical axis of lateral illumination is presented. Directional movements of cells are shown by the tilted lines over time. The tilted lines from the left-upper to the right-lower side and from the right-upper to the left-lower side presented positive and negative phototaxis, respectively. Lateral illumination was applied with a time interval of 4 min and indicated by the dashed white lines (see also Videos 5 and 6). The delay of the cell response after the illumination was turned on is indicated by the dashed yellow lines.

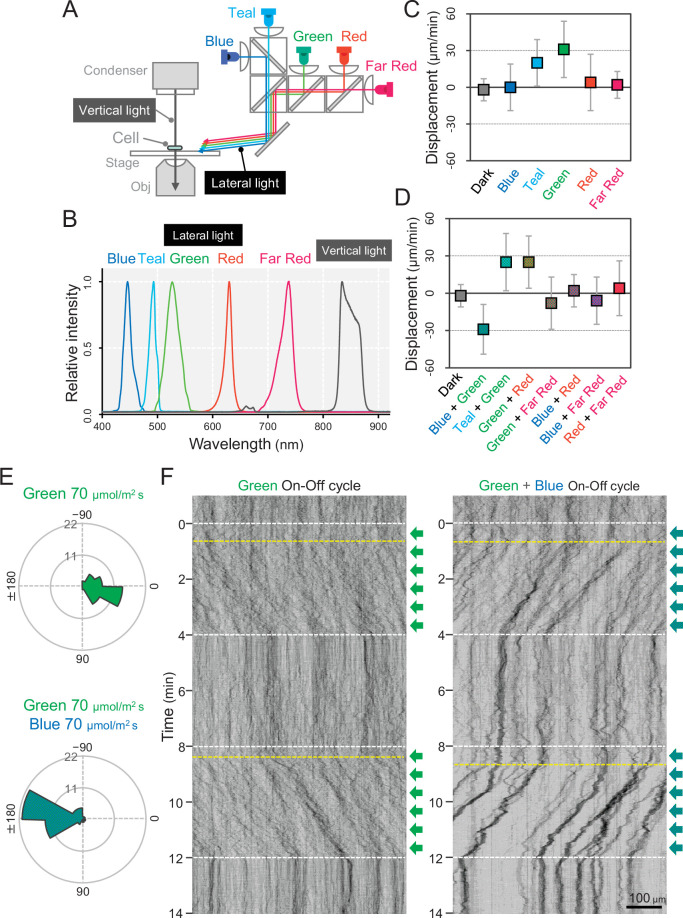
Figure 2—source data 1. Effects of the light source on the phototactic behaviour of cells on a glass surface.
Figure 2—source data 2. Rose plots.

Figure 2.

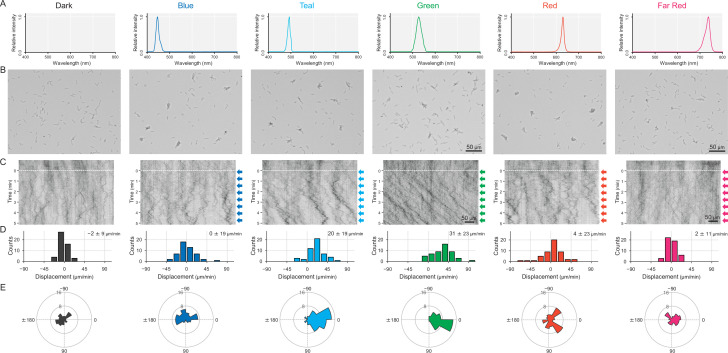
Figure 2—figure supplement 1. Cell movement after applying a monochromatic light source.

Figure 2—figure supplement 1.

(A) Spectra of each LED used for stimulation. No lateral illumination in the dark condition. Infrared light was used for cell observation from a halogen lamp through a bandpass filter (see more detail in Figure 2A,B and Materials and methods). (B) Cell images at 4 min after the lateral light was turned on. Lateral light from each LED was adjusted at a fluence rate of 70 μmol m−2 s−1 and applied from the right side of the image. (C) Kymograph of cell movements along the optical axis of lateral illumination. Directional movements of cells are presented by the tilted lines over time. Lateral light illumination was turned on at time 0, presented as a dashed white line. (D) Histograms of the cell displacement along the lateral light axis. Cell movements towards the light source are shown as a positive value. (E) Rose plots. The moving direction of a cell that translocated more than 6 μm min−1 was counted. Angle 0 was the direction towards the lateral light source. The cell displacement for a duration of 1 min was measured at 4 min after lateral illumination was turned on (N = 50 cells).
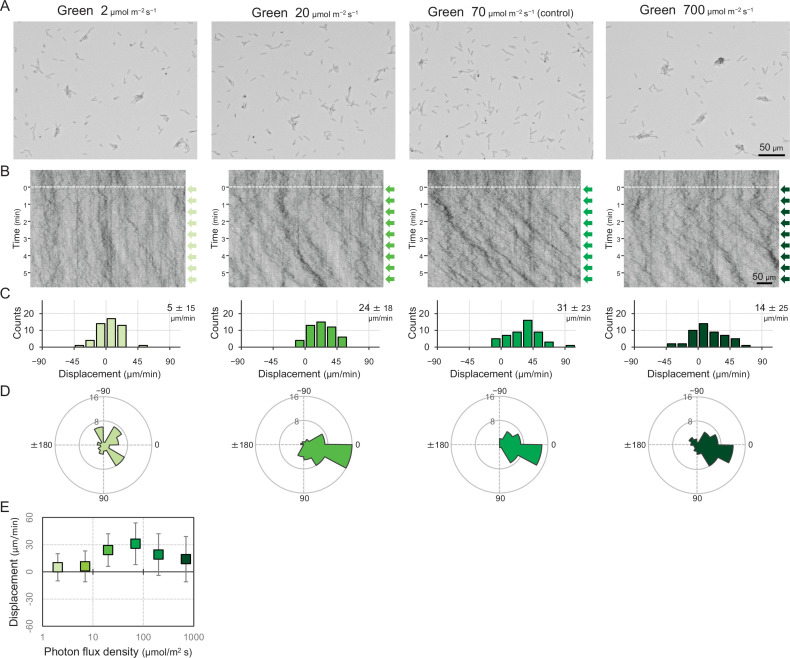
Figure 2—figure supplement 2. Cell movement at various fluence rates of a lateral green light.

Figure 2—figure supplement 2.

(A) Cell images at 4 min after the lateral light was turned on. (B) Kymograph of cell movements along the optical axis of lateral illumination. Directional movements of cells are presented by the tilted lines over time. Lateral light illumination was turned on at time 0, presented as a dashed white line. (C) Histograms of the cell displacement along the lateral light axis. Cell movements towards the light source are shown as a positive value. (D) Rose plots. The moving direction of a cell that translocated more than 6 μm min−1 was counted. Angle 0 was the direction towards the lateral light source. The cell displacement for a duration of 1 min was measured at 4 min after lateral illumination was turned on (N = 50 cells). (E) Effects of the fluence rate on the phototactic behaviour of cells. The average and standard deviation (SD) of the cell displacement along the light axis are presented (N = 50).
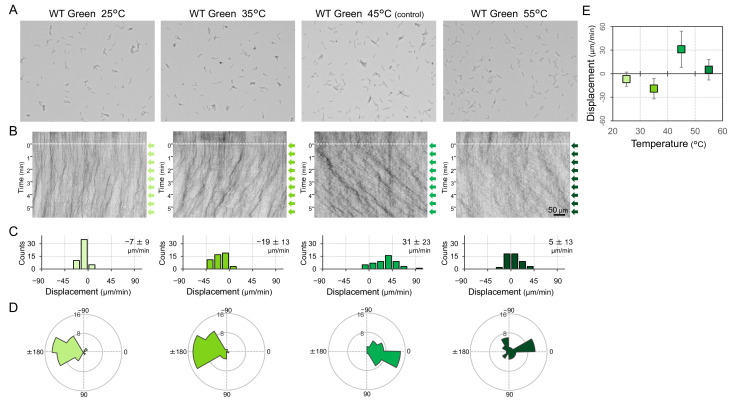
Figure 2—figure supplement 3. Phototactic behaviour of wild type (WT) cells at various temperatures.

Figure 2—figure supplement 3.

Lateral light from a single LED was adjusted to a fluence rate of 70 μmol m−2 s−1 and applied from the right side of the image. (A) Cell image at 4 min after the lateral light was turned on. (B) Kymograph of cell movements along the optical axis of lateral illumination. Directional movements of cells are presented by the tilted lines over time. Lateral light illumination was turned on at time 0, presented as a dashed white line. (C) Histograms of the cell displacement along the lateral light axis. Cell movements towards the light source are shown as a positive value. (D) Rose plots. The moving direction of a cell that translocated more than 6 μm min−1 was counted. Angle 0 was the direction towards the lateral light source. The cell displacement for a duration of 1 min was measured at 4 min after lateral illumination was turned on (N = 50 cells). (E) Effects of the fluence rate on the phototactic behaviour of WT cells. The average and standard deviation (SD) of the cell displacement along the light axis are presented (N = 50).
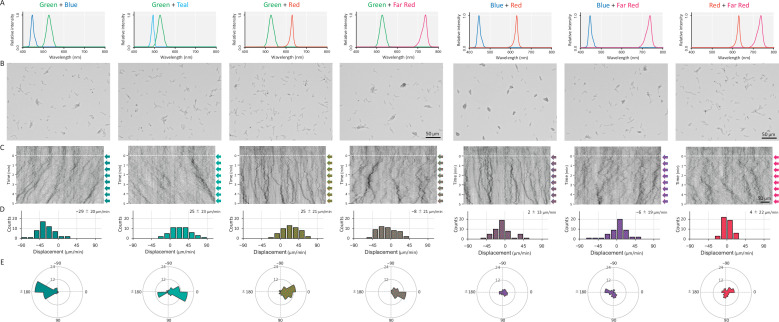
Figure 2—figure supplement 4. Cell movement after applying a dichromatic light source.

Figure 2—figure supplement 4.

(A) Spectra of two LEDs used for stimulation. (B) Cell images at 4 min after the lateral light was turned on. Lateral light from two LEDs was adjusted at a fluence rate of 70 μmol m−2 s−1 for each LED and applied from the right side of the image. (C) Kymograph of cell movements along the optical axis of lateral illumination. Directional movements of cells are presented by the tilted lines over time. Lateral light illumination was turned on at time 0, presented as a dashed white line. (D) Histograms of the cell displacement along the lateral light axis. Cell movements towards the light source are shown as a positive value. (E) Rose plots. The moving direction of a cell that translocated more than 6 μm min−1 was counted. Angle 0 was the direction towards the lateral light source. The cell displacement for a duration of 1 min was measured at 4 min after lateral illumination was turned on (N = 50 cells).
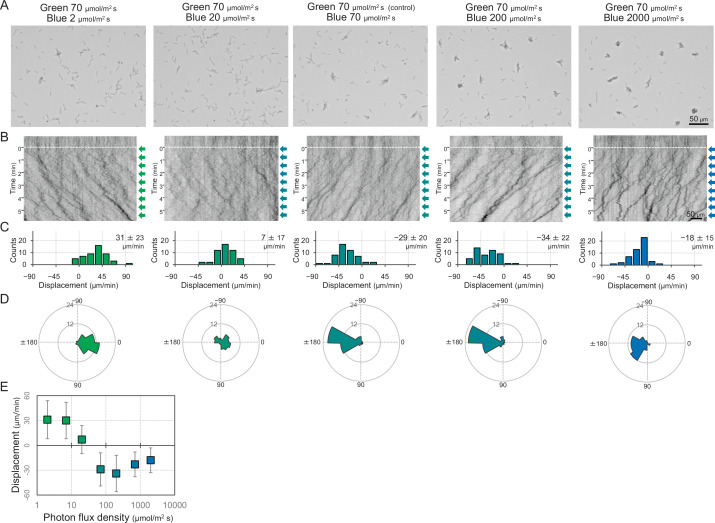
Figure 2—figure supplement 5. Dose dependency of blue light to induce negative phototaxis.

Figure 2—figure supplement 5.

Lateral blue light was adjusted at various fluence rates, while lateral green light was fixed at 70 μmol m−2 s−1, as presented at the top. (A) Cell images at 4 min after the lateral light was turned on. (B) Kymograph of cell movements along the optical axis of lateral illumination. Directional movements of cells are presented by the tilted lines over time. Lateral light illumination was turned on at time 0, presented as a dashed white line. (C) Histograms of the cell displacement along the lateral light axis. Cell movements towards the light source are shown as a positive value. (D) Rose plots. The moving direction of a cell that translocated more than 6 μm min−1 was counted. Angle 0 was the direction towards the lateral light source. The cell displacement for a duration of 1 min was measured at 4 min after lateral illumination was turned on (N = 50 cells). (E) Effects of the fluence rate of blue light to induce negative phototaxis. The average and standard deviation (SD) of the cell displacement along the light axis are presented (N = 50).
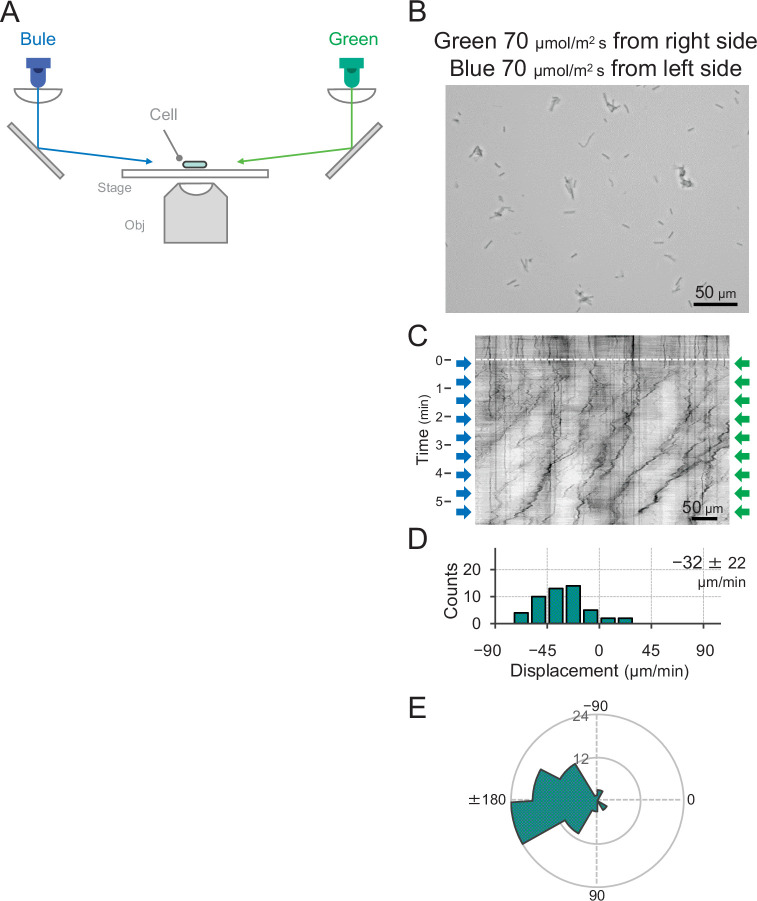
Figure 2—figure supplement 6. Effect of blue light illumination from the other side of green light on phototaxis.

Figure 2—figure supplement 6.

(A) Schematic of the lateral light illumination. Blue and green light were applied from the left and right sides of the image at 70 μmol m−2 s−1, respectively. (B) Cell images at 4 min after the lateral light was turned on. (C) Kymograph of cell movements along the optical axis of lateral illumination. Directional movements of cells are presented by the tilted lines over time. Lateral light illumination was turned on at time 0, presented as a dashed white line. (D) Histograms of the cell displacement along the lateral light axis. Cell movements towards the light source are shown as a positive value. The average and standard deviation (SD) of the cell displacement along the light axis are presented (N = 50). (E) Rose plots. The moving direction of a cell that translocated more than 6 μm min−1 was counted. Angle 0 was the direction towards the lateral light source of the green light. The cell displacement for a duration of 1 min was measured at 4 min after lateral illumination was turned on (N = 50 cells).