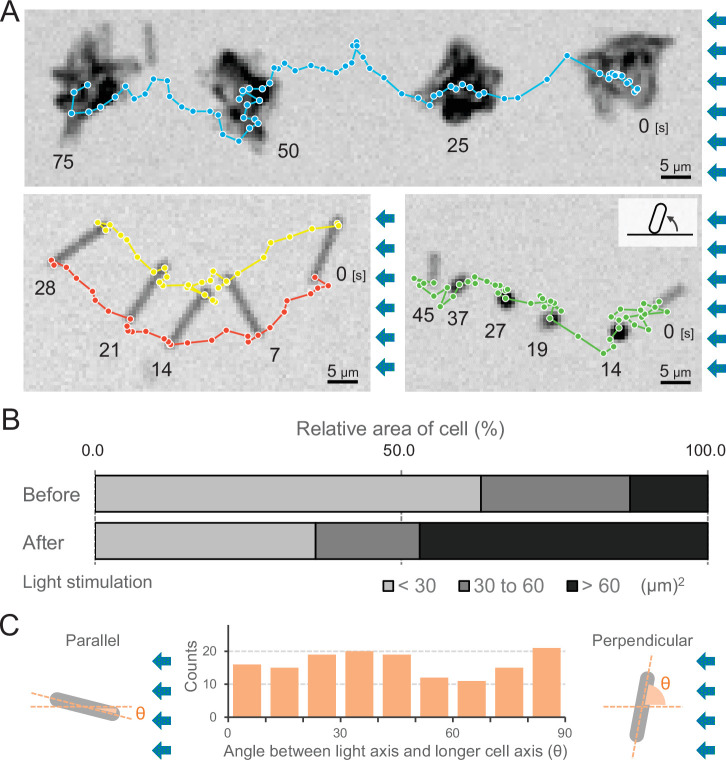
Figure 6. Moving trajectories of cells during negative phototaxis.
(A) Cell images and moving trajectories. Images were integrated with a single image at each time duration presented (see also Videos 12–14). Upper: movement of microcolonies. Left bottom: cell perpendicular to lateral light axis. Right bottom: cell that stood up and kept binding at a cell pole. (B) Cell–cell interaction. The area of a cell moving as a single unit was measured before and after the induction of negative phototaxis and presented as the ratio by the area (N = 353). (C) Moving direction of a cell in relation to the light source. The orientation of single cells during negative phototaxis was measured, and the distribution is presented (N = 148). The absolute angle of the longer axis of a cell was measured in relation to the lateral light axis. The parallel cellular orientation to the light axis (shown on the left) was taken as 0°, whereas the perpendicular orientation (shown on the right) was ideally 90°.

