. 2022 May 10;11:e73913. doi: 10.7554/eLife.73913

Figure 1. HSD17B11 is necessary for DAC (S)–3 cytotoxic activity.

(A) DAC (S)–3 and (R)–3 structures. (B) Cell viability analysis of HAP-1 or U2OS cells treated for 72 h with the indicated concentrations of (S)- or (R)–3. (C) Cell viability analysis of individual DAC-resistant clones or wild-type HAP-1 treated for 72 hr with the indicated concentrations of (S)–3. (D) List of mutations identified by RNA-seq or targeted sequencing of HSD17B11 in individual DAC-resistant clones. (E) Schematic representation of HSD17B11 functional domains. The positions of the identified mutations are indicated in red. The Y185, K189 (indicated in black), and S172 amino acids are critical for catalysis. (F) Analysis by immunoblotting of HSD17B11 levels in wild-type HAP-1 and DAC-resistant clones. Ku80 was used as a loading control. The black arrow indicates HSD17B11 position. (G) Analysis by immunoblotting of HSD17B11-GFP levels in individual clones of DAC-resistant clone A5 complemented with GFP, wild-type or S172L mutant HSD17B11-GFP. SAF-A and total H2AX were used as loading controls. (H) Cell viability analysis of individual clones of DAC-resistant clone A5 complemented with GFP, wild-type or S172L mutant HSD17B11-GFP treated for 72 h with the indicated concentrations of (S)–3.

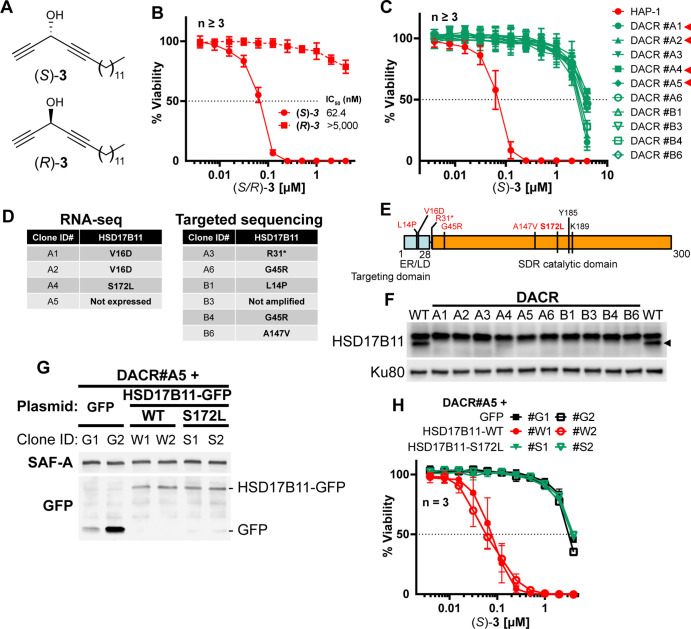
Figure 1—source data 1. Source data related to Figure 1F.
The tiff files correspond to uncropped pictures of the chemiluminescent signal acquired on a BioRad Chemidoc. The regions used to generate the figure are highlighted by back squares in the jpg file, which also contains at the bottom an overlay with a picture of the membrane to locate the protein ladder positions.
Figure 1—source data 2. Source data related to Figure 1G.
The tiff files correspond to uncropped pictures of the chemiluminescent signal acquired on a BioRad Chemidoc. The regions used to generate the figure are highlighted by back squares in the jpg file, which also contains at the bottom an overlay with a picture of the membrane to locate the protein ladder positions.

Figure 1.

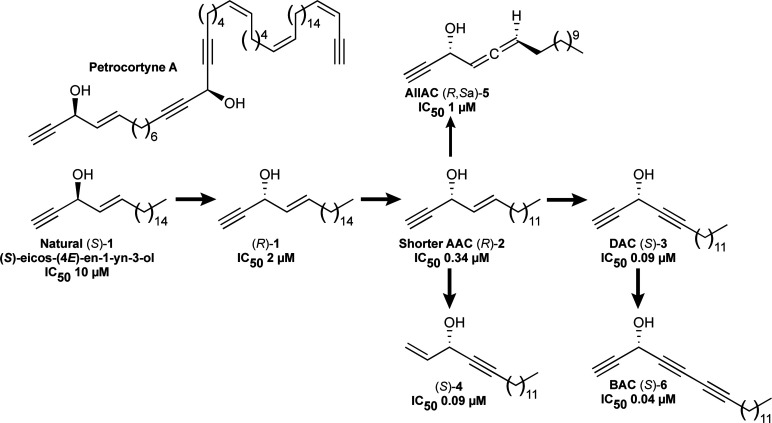
Figure 1—figure supplement 1. Representative structures of natural and bioinspired synthetic alkynylcarbinol-containing cytotoxic molecules.

Figure 1—figure supplement 1.

Previously reported IC50 values, evaluated in HCT116 cells, are indicated when available.
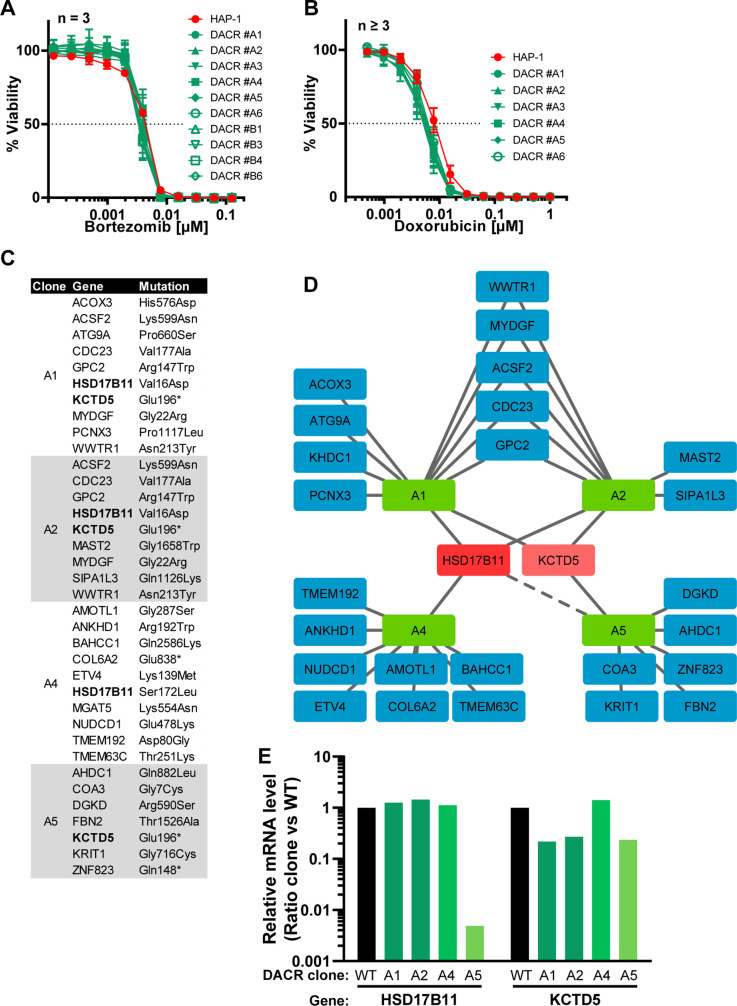
Figure 1—figure supplement 2. Characterization of DACR clones.

Figure 1—figure supplement 2.

(A) Cell viability analysis of DAC-resistant clones (DACR) or wild-type HAP-1 treated for 72 h with indicated concentrations of the proteasome inhibitor bortezomib. (B) Cell viability analysis of DAC-resistant clones (DACR) or wild-type HAP-1 treated for 72 h with indicated concentrations of the DNA damaging agent doxorubicin. (C) List of genes carrying near homozygous non- or mis-sense mutations in each clone. For each gene, the impact on the protein sequence is specified. (D) Graphical representation of the genes identified as mutated in each clone. The genes mutated in more than two clones are highlighted in red. The dashed line indicates that HSD17B11 is not expressed in the DACR#A5 clone. (E) Histogram representing the ratio between the normalized levels (Reads Per Kilobase Million) of HSD17B11 and KCTD5 mRNAs in each mutant clone as compared to the wild-type HAP-1. Reduced KCTD5 levels in DACR#A1, #A2 and #A5 might result from the KCTD5 mRNA, which carries a premature stop codon, being recognized and processed by non-sense-mediated decay.
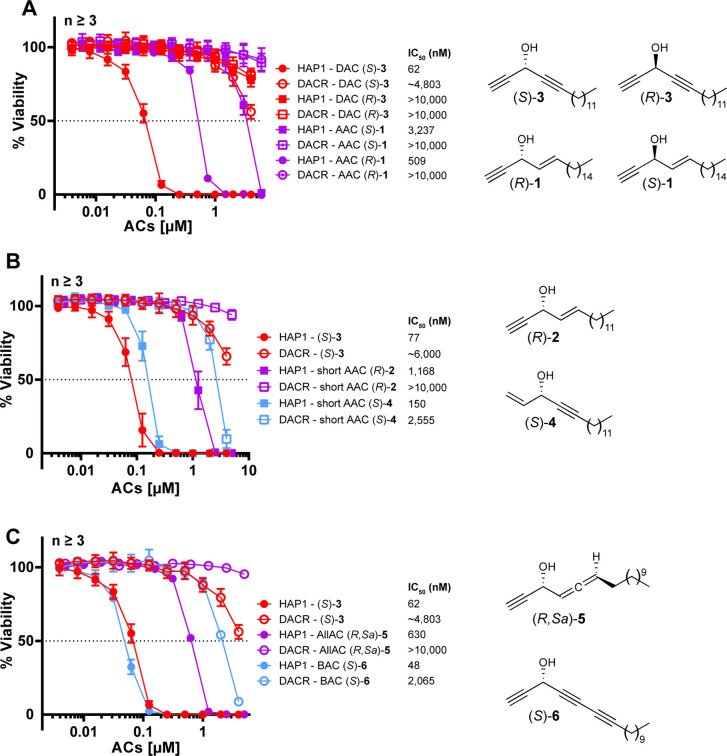
Figure 1—figure supplement 3. HSD17B11 inactivation confers resistance to multiple alkynylcarbinol-containing molecules (ACs) of similar configuration.

Figure 1—figure supplement 3.

(A) Cell viability analysis of DAC-resistant HAP-1 clone #A4 (DACR) treated for 72 h with the indicated concentrations of each of the molecules represented on the right of the panel. (B) Cell viability analysis of DAC-resistant HAP-1 clone #A4 (DACR) treated for 72 h with the indicated concentrations of each of the molecules represented on the right of the panel. (C) Cell viability analysis of DAC-resistant HAP-1 clone #A4 (DACR) treated for 72 h with the indicated concentrations of each of the molecules represented on the right of the panel.
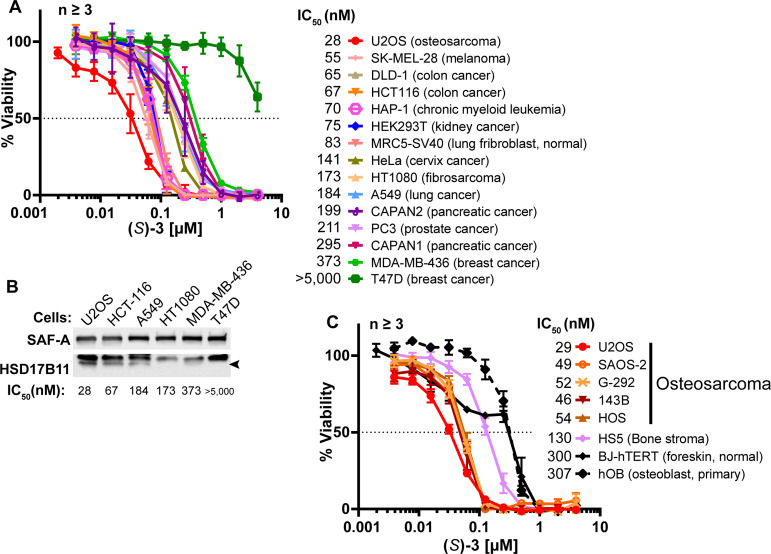
Figure 1—figure supplement 4. DAC (S)–3 cytotoxic activity is HSD17B11-dependent in multiple cell lines.

Figure 1—figure supplement 4.

(A) Cell viability analysis of a panel of 15 cell lines treated for 72 h with DAC (S)–3. (B) Analysis of HSD17B11 levels by immunoblotting in six selected cell lines from the panel. SAF-A was used as a loading control. (C) Cell viability analysis of a panel of osteosarcoma cell lines and related control cells treated for 72 h with DAC (S)–3.
Figure 1—figure supplement 4—source data 1. Source data related to Figure 1—figure supplement 4B.
The tiff files correspond to uncropped pictures of the chemiluminescent signal acquired on a BioRad Chemidoc. The regions used to generate the figure are highlighted by back squares in the jpg file, which also contains at the bottom an overlay with a picture of the membrane to locate the protein ladder positions.
Figure 1—figure supplement 5. DAC (S)–3 cytotoxic activity is HSD17B11-dependent in multiple cell lines.

Figure 1—figure supplement 5.

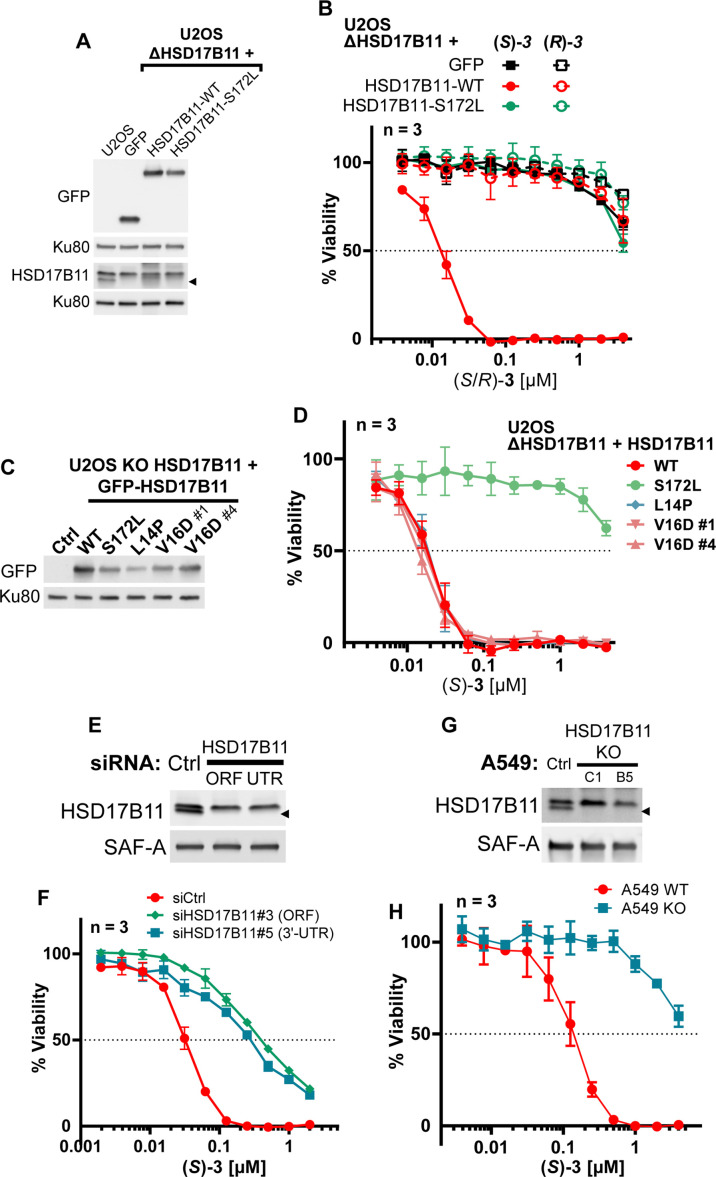
(A) Analysis of HSD17B11 and HSD17B11-GFP levels in wild-type U2OS or U2OS inactivated for HSD17B11 using CRISPR/Cas9 and stably complemented with GFP or GFP-tagged wild-type or S172L HSD17B11. The black arrow indicates the position of endogenous HSD17B11. Ku80 was used as a loading control. (B) Cell viability analysis of U2OS inactivated for HSD17B11, complemented as shown in (A) and treated for 72 h with DAC (S)- or (R)–3. (C) Analysis by immunoblotting of HSD17B11-GFP levels in wild-type U2OS (ctrl) or U2OS inactivated for HSD17B11 using CRISPR/Cas9 and stably complemented with wild-type or the indicated HSD17B11-GFP mutants. (D) Cell viability analysis of U2OS inactivated for HSD17B11, complemented as shown in (C) and treated for 72 h with DAC (S)–3. (E) Analysis by immunoblotting of HSD17B11 levels in U2OS cells 72 hr after transfection by control or HSD17B11 siRNAs. SAF-A was used as a loading control. (F) Cell viability analysis of U2OS cells transfected by siRNA as shown in (E) and treated for 72 h with DAC (S)–3. (G) Analysis by immunoblotting of HSD17B11 levels in wild-type A549 cells or in individual clones inactivated for HSD17B11 using CRISPR/Cas9. SAF-A was used as a loading control. (H) Cell viability analysis of wild-type or HSD17B11-deficient (clone #C1) A549 cells treated for 72 h with DAC (S)–3.
Figure 1—figure supplement 5—source data 1. Source data related to Figure 1—figure supplement 5A.
The tiff files correspond to uncropped pictures of the chemiluminescent signal acquired on a BioRad Chemidoc. Two different immunoblotting of the same extracts were used for this figure (respectively labeled upper and lower). The regions used to generate the figure are highlighted for each immunoblot by back squares in the jpg files, which also contain at the bottom an overlay with a picture of the membrane to locate the protein ladder positions.
Figure 1—figure supplement 5—source data 2. Source data related to Figure 1—figure supplement 5C.
The tiff files correspond to uncropped pictures of the chemiluminescent signal acquired using autoradiographic films. The regions used to generate the figure are highlighted for each immunoblot by back squares in the jpg files.
Figure 1—figure supplement 5—source data 3. Source data related to Figure 1—figure supplement 5E.
The tiff files correspond to uncropped pictures of the chemiluminescent signal acquired on a BioRad Chemidoc. The regions used to generate the figure are highlighted by back squares in the jpg file, which also contains at the bottom an overlay with a picture of the membrane to locate the protein ladder positions.
Figure 1—figure supplement 5—source data 4. Source data related to Figure 1—figure supplement 5G.
The tiff files correspond to uncropped pictures of the chemiluminescent signal acquired on a BioRad Chemidoc. The regions used to generate the figure are highlighted by back squares in the jpg file, which also contains at the bottom an overlay with a picture of the membrane to locate the protein ladder positions.