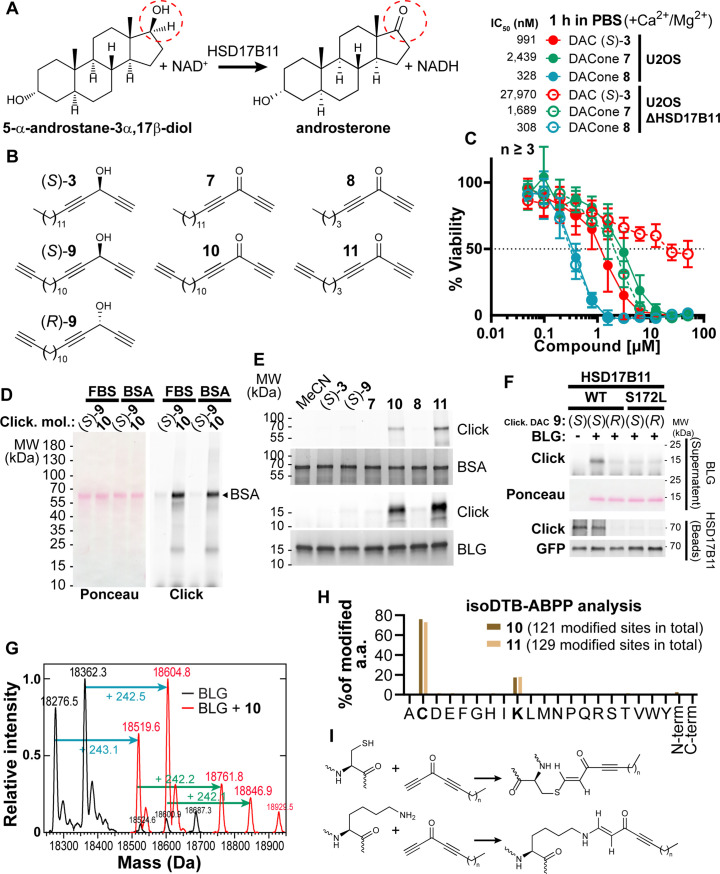
Figure 2. DACones are protein reactive species.
(A) Reaction catalyzed by HSD17B11. (B) Clickable DACs and DACones used in the study. (C) Viability analysis of U2OS cells treated in PBS for 1 h with (S)–3 or DACones and incubated for an additional 72 h after drug washout. (D) FBS or purified BSA were incubated 40 min at 30 °C with clickable DAC (S)–9 or clickable DACone 10. After reaction, CuAAC was used to ligate an azido-AlexaFluor647 to clickable molecules. Modified proteins were detected by scanning membrane fluorescence after SDS-PAGE and transfer. Ponceau S stains total proteins. (E) BSA or BLG were incubated with the indicated DACs or DACones, as in (D). After reaction, modified proteins were detected as in (D). Coomassie stains total proteins. (F) WT or S172L HSD17B11-GFP were immunoprecipitated from complemented U2OS KO HSD17B11 cells and incubated with clickable DAC 9 and BLG. After reaction, modified proteins were detected in the supernatant (BLG) or on the beads (HSD17B11-GFP) as in (D). GFP immunoblotting confirmed that equal amounts of WT and S172L proteins were used. (G) Analysis by direct-infusion mass spectrometry of purified BLG (mixture of isoform A and B) modified or not by DACone 10. Cyan and green arrows indicate the formation of a first and second adduct, respectively. (H) % of each amino acid detected as modified by DACones 10 or 11 in U2OS extracts as determined using an isoDTB-ABPP-based framework. (I) Proposed reactions of DACones with cysteine and lysine side chains in proteins.

