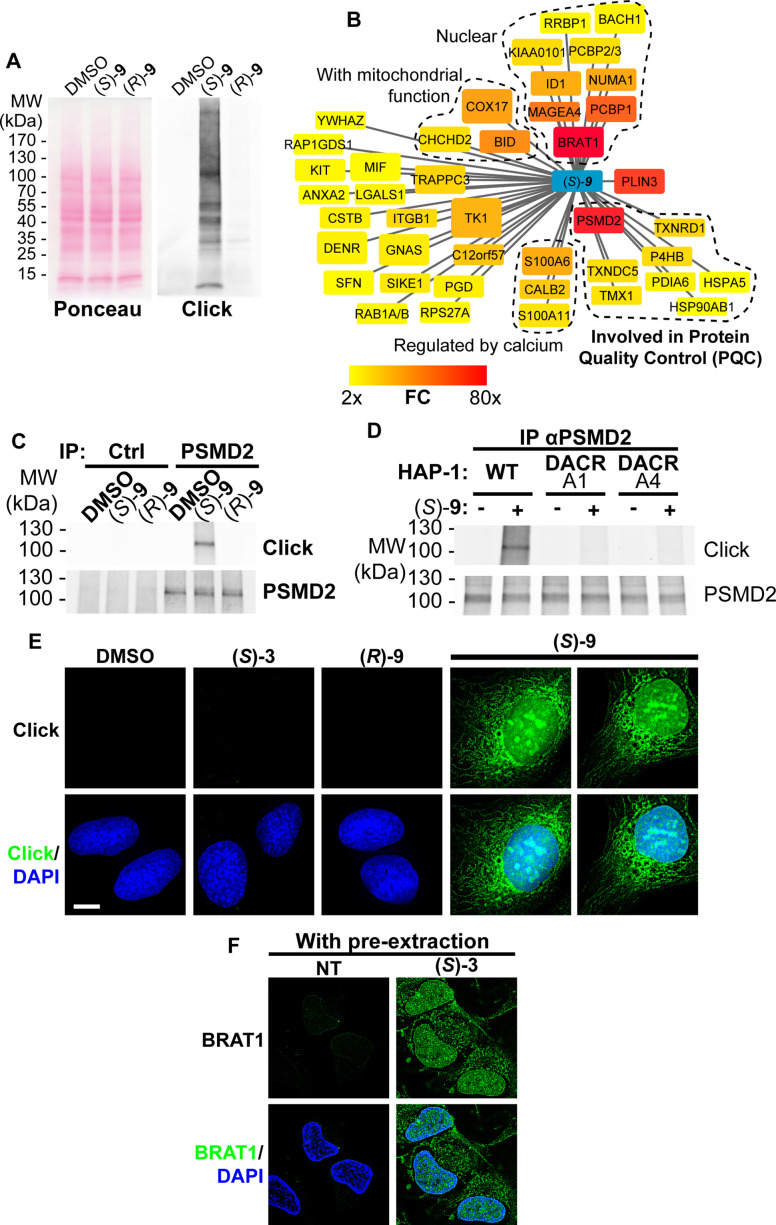
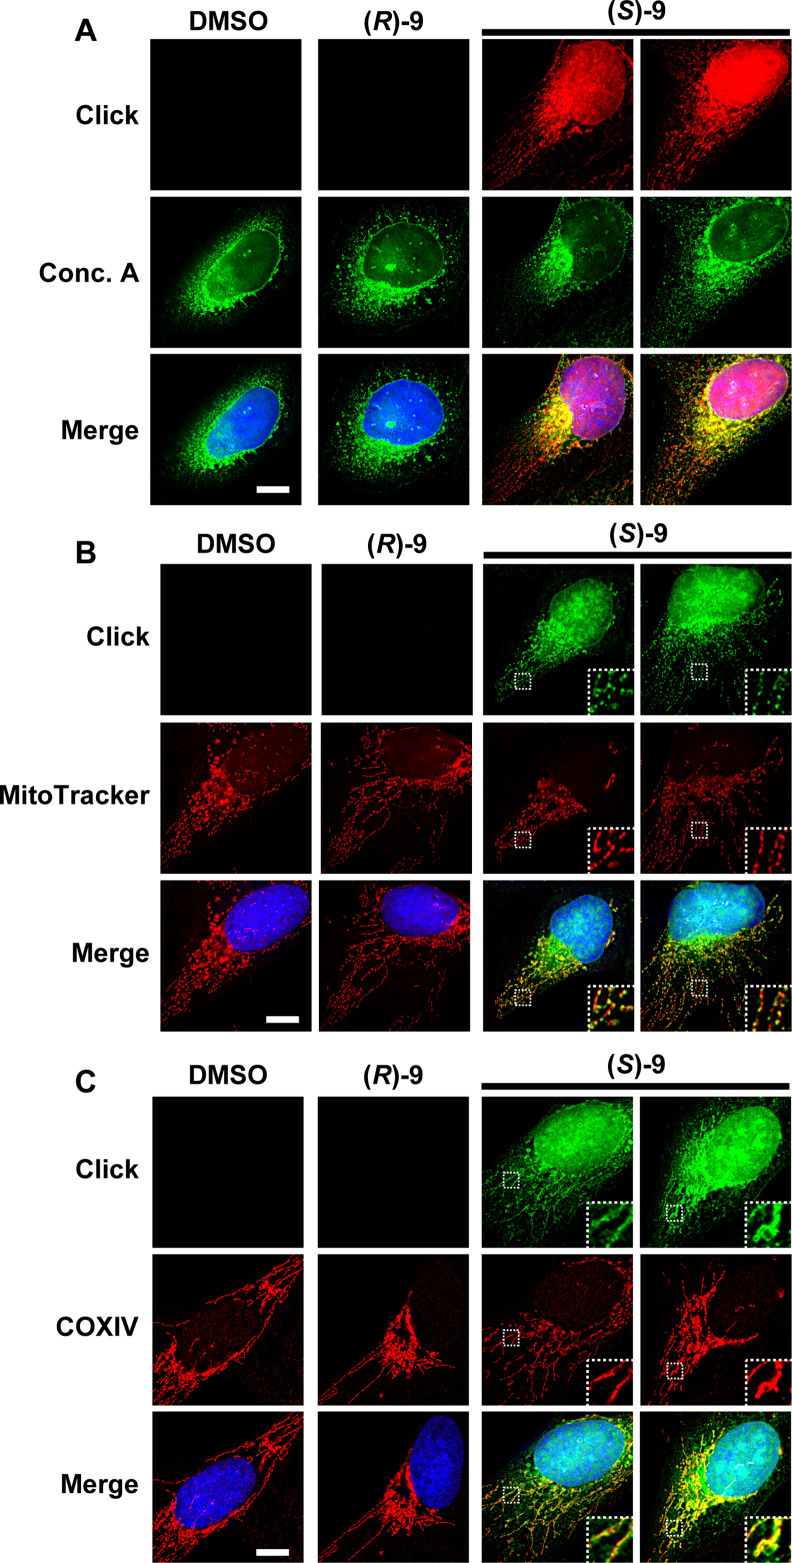
Figure 3. (S)-DACs lipoxidize multiple cellular proteins, triggering their association with cellular membranes.
(A) U2OS cells were incubated for 2 h with 2 µM (S)- or (R)–9, proteins were extracted and DAC-modified proteins were detected by CuAAC-mediated ligation of azido-AlexaFluor-647 to clickable molecules, separation by SDS-PAGE, transfer to a membrane which was scanned for fluorescence. (B) Landscape of proteins modified in U2OS cells by clickable DAC (S)–9 computed from three independent experiments. Fold enrichment (FC) as compared to the clickable (R)–9 is computed and color-coded as depicted. Box size corresponds to -log(p) computed as described in the materials and methods section. (C) PSMD2 or control immunoprecipitations (Ctrl) were performed from extracts of U2OS cells treated 2 h with 2 µM clickable DAC (S)- or (R)–9. DAC-modified proteins were detected by CuAAC-mediated ligation of azido-AlexaFluor-647 to clickable molecules, separation by SDS-PAGE, transfer to a membrane, which was scanned for fluorescence. PSMD2 was subsequently visualized by immunoblotting. (D) PSMD2 immunoprecipitations were performed from extracts of wild-type or DAC-resistant HAP-1 cells treated or not for 2 h with 2 µM clickable DAC (S)–9. DAC-modified proteins were detected by CuAAC-mediated ligation as in (C). PSMD2 was subsequently visualized by immunoblotting. (E) U2OS cells were treated 2 h with 0.5 µM DAC, fixed, permeabilized, and clickable molecules were detected by click with AlexaFluor488 azide. (F) U2OS expressing GFP-BRAT1 were treated 2 h with 1 µM (S)–3, pre-extracted, fixed and processed for analysis by fluorescence microscopy.
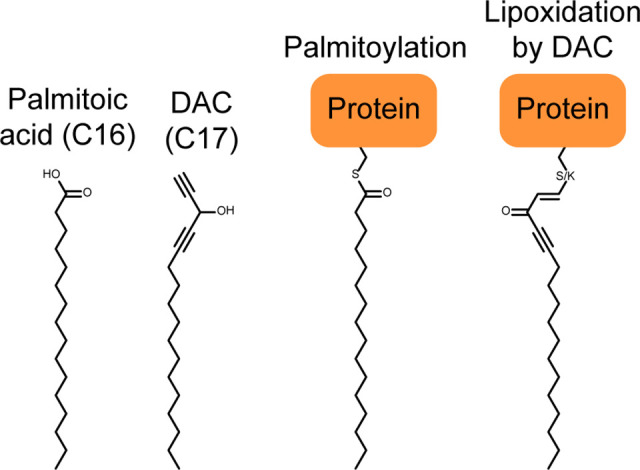
Figure 3—figure supplement 1. Parallel between protein palmitoylation and protein lipoxidation by the DAC 3.
