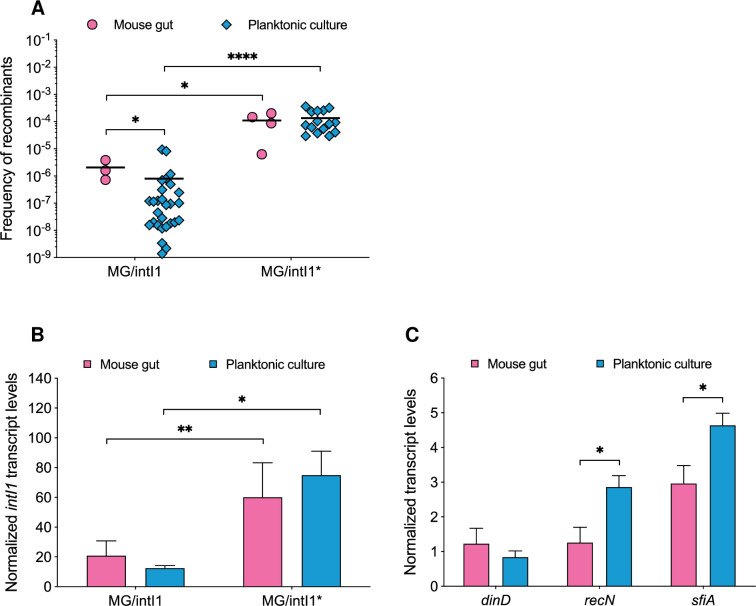
Fig 3. Comparisons of recombination activity of IntI1 and expression of intI1 and SOS regulon genes, in vivo versus in vitro.
(A) Recombination activity of IntI1, reflected by the frequency of recombinants (FR), was estimated by determining the frequency of emergence of tobramycin-resistant recombinants, as a result of specific recombination between attC sites located on a synthetic array of two cassettes (attCaadA7-cat(T4)-attCVCR2-aac(6’)-Ib*) carried on plasmid p6851. The FR was calculated in MG/intI1 (carrying p6851 and pZE1intI1 allowing the expression of intI1 SOS-regulated) and MG/intI1* (carrying p6851 and pZE1intI1* allowing the constitutive expression of intI1), in the mouse gut and in 24-h-old-planktonic cultures. Each symbol represents the FR calculated from a single mouse exhibiting recombinants on days 2 and 3 post inoculation (n = 3 for MG/intI1 and n = 4 for MG/intI1*) and from planktonic cultures (n = 28 for MG/intI1 and n = 15 for MG/intI1*). For each condition, the average FR is shown as a black horizontal line. Transcript levels of (B) the intI1 gene in MG/intI1 and MG/intI1* and (C) the SOS regulon genes dinD, recN and sfiA, in MG/intI1 in the mouse gut and in 24-h-old-planktonic cultures are represented. Transcript levels were normalized to the housekeeping gene dxs. Error bars indicate the SD. Differences were determined using the Mann-Whitney U test. *p < 0.05, **p < 0.01 and ****p < 0.0001.

