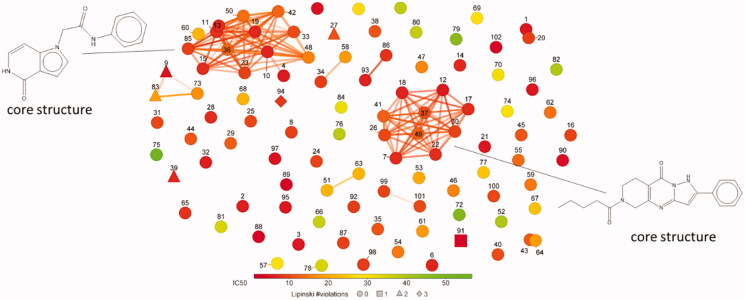
Figure 3.
A plot of FragFp similarity for the non-toxic, specific apPOL inhibitors (102 compounds). Chemical similarity was calculated using the DataWarrior22 software package. The core structure for the two largest clusters are given. Each compound is labelled with a number corresponding to the data in Supplemental file 1. The markers are coloured according to IC50 values and the number of Lipinski violations are indicated by marker shape.

