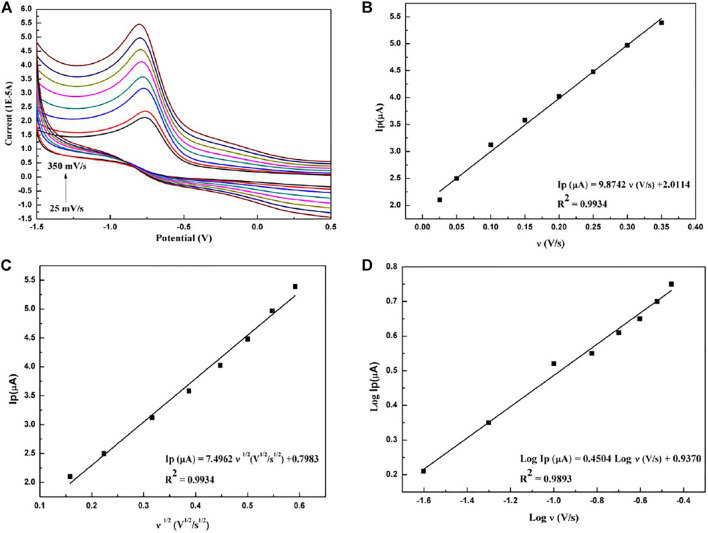
FIGURE 4.
(A) Cyclic voltammograms of paclitaxel (1 × 10⁻⁵ mol/L) with different scan rates: 0.025, 0.05, 0.10, 0.15, 0.20, 0.25, 0.30, and 0.35 V/s. (B) Dependence of peak current on scan rate. (C) Dependence of peak current on the square root of scan rate. (D) The linear relationship between the logarithm of peak current and logarithm of scan rate.

