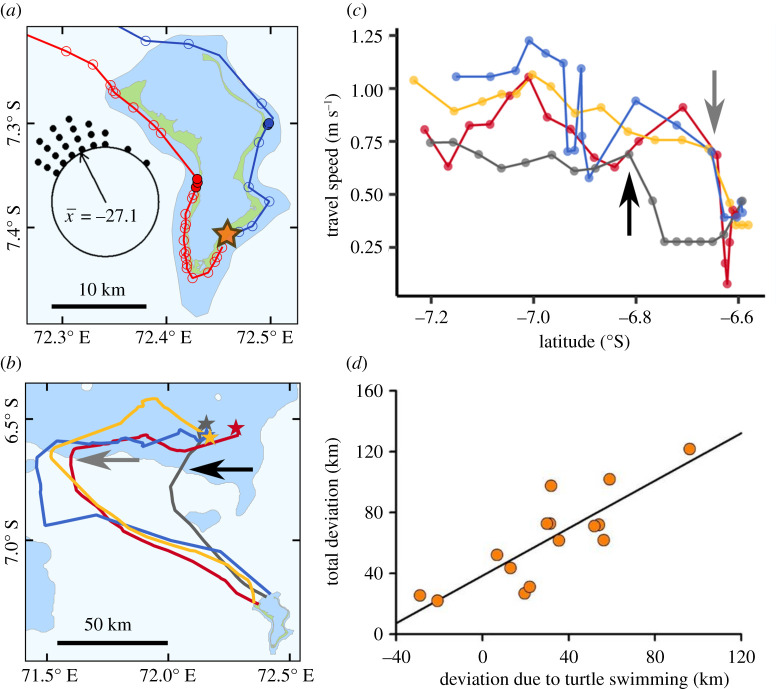
Figure 2.
(a) The initial tracks of two hawksbill turtles beginning their post-nesting migration (open and filled symbols represent daytime and night-time locations, respectively). Water depths shallower than 200 m are indicated by blue shading. On departure from nesting beaches at the southeast of Diego Garcia island (orange star), turtles moved to the northern end of the island without any noticeable delay only slowing down at night. Inset shows the initial departure directions of 22 hawksbill turtles from Diego Garcia. The direction of the beeline route to the target is represented by 0° with the departure angle plotted in 10° increments. Turtles tended to head westwards of the direct route to their target. (b) Turtles tended to initially follow very straight-line oceanic crossings and then often turned to a more target-oriented direction when either in the open ocean or when they encountered shallow water. In this case, four tracks are shown for hawksbills migrating to the foraging sites on the Great Chagos Bank. (c) Associated with the reorientation in shallow water, the speed of travel tended to slow. Arrows in (b) and (c) indicate when two individuals encountered shallow water (less than 200 m). (d) For turtles migrating to foraging sites on the Great Chagos Bank, the total deviation off the beeline to the target after they completed their oceanic crossing versus the amount of this deviation that was caused by the turtles' active swimming. Negative values indicate that the turtles’ active swimming helped compensate for current advection, which only occurred in 2 of 15 cases. Total deviation (km) = 38.4 + 0.781 (deviation due to swimming; r2 = 0.69, F1,13 = 28.9, p < 0.001).

