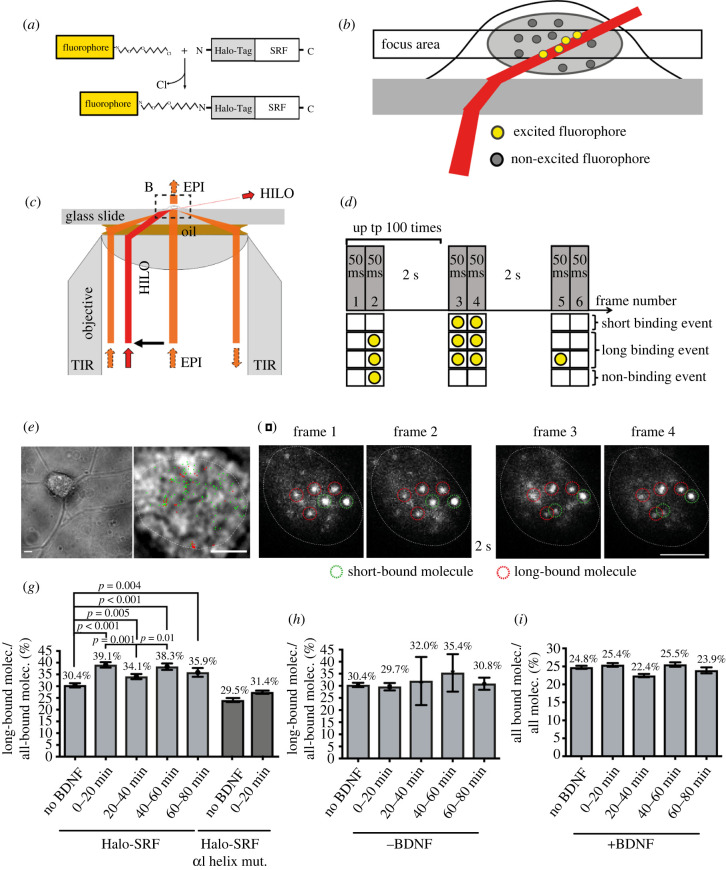
Figure 1.
Neuronal activation with BDNF enhances the long-bound DNA fraction of SRF. (a) Schematic showing fluorescent labelling of SRF molecules using a Halo-tag and a Halo-Tag specific Janelia Fluor 646 (JF646) fluorophore. (b) Schematic illustrating the excitation scheme for live-cell imaging of Halo-SRF using HILO illumination. (c) Schematic of the beampath within the microscope objective for HILO illumination in comparison to epi and TIR illumination. (d) Scheme of interlaced time-lapse microscopy (ITM). Here, two consecutive frames of 50 ms illumination were followed by a 2 s dark time for 100 repeats. Molecules detected in two consecutive illumination frames were short binding events. A molecule surviving at least one dark-time was counted as a long binding event. Molecules visible in only one illumination frame were considered non-binding molecules. (e) Exemplary frame from a ITM movie of a neuron lentivirally transduced with Halo-SRF overlayed with the determined position from all bound molecules for the respective movie (short binding (green) and long-bound (red) molecules). Superimposed is the outline of the cell nucleus (white dashed line) determined from the respective bright field images. (f) Representative examples of four consecutive frames from an ITM movie. Long-bound molecule were present in all four frames (red dashed circles). Short-bound molecules were present in two consecutive frames only (green dashed circles). (g) Neurons expressing Halo-SRF (light grey bars) or mutated SRF αI helix (dark grey bars) were stimulated for indicated time intervals with BDNF and the percentage of long-bound molecules versus all bound molecules was determined from ITM movies. n = 2472 molecules, 60 cells (no BDNF); n = 1782 molecules, 45 cells (0–20 min BDNF); n = 1807 molecules, 38 cells (20–40 min BDNF); n = 1224 molecules, 26 cells (40–60 min BDNF); n = 655 molecules, 13 cells (60–80 min BDNF). n (SRF αI helix) = 1889 molecules, 21 cells (no BDNF); n (SRF αI helix) = 2859 molecules, 33 cells (0–20 min BDNF). (h) Fraction of long-bound Halo-SRF events versus all binding events determined by ITM from neurons during 80 min without BDNF. n = 2472 molecules (no BDNF); n = 1202 molecules (0–20 min no BDNF); n = 1749 molecules (20–40 min no BDNF); n = 1043 molecules (40–60 min no BDNF); n = 505 molecules (60–80 min no BDNF). (i) Fraction of all bound SRF molecules determined from ITM movies with and without BDNF stimulation. n = 9986 molecules (no BDNF); n = 7013 molecules (0–20 min BDNF); n = 8050 molecules (20–40 min BDNF); n = 4798 molecules (40–60 min BDNF); n = 2739 molecules (60–80 min BDNF). Data in (h-i) depict molecule-wise analysis with mean ± error. p-values and errors were calculated by two-sample binomial test. Scale bars: (e) 10 µm; (e, zoom) 5 µm; (f) 5 µm.

