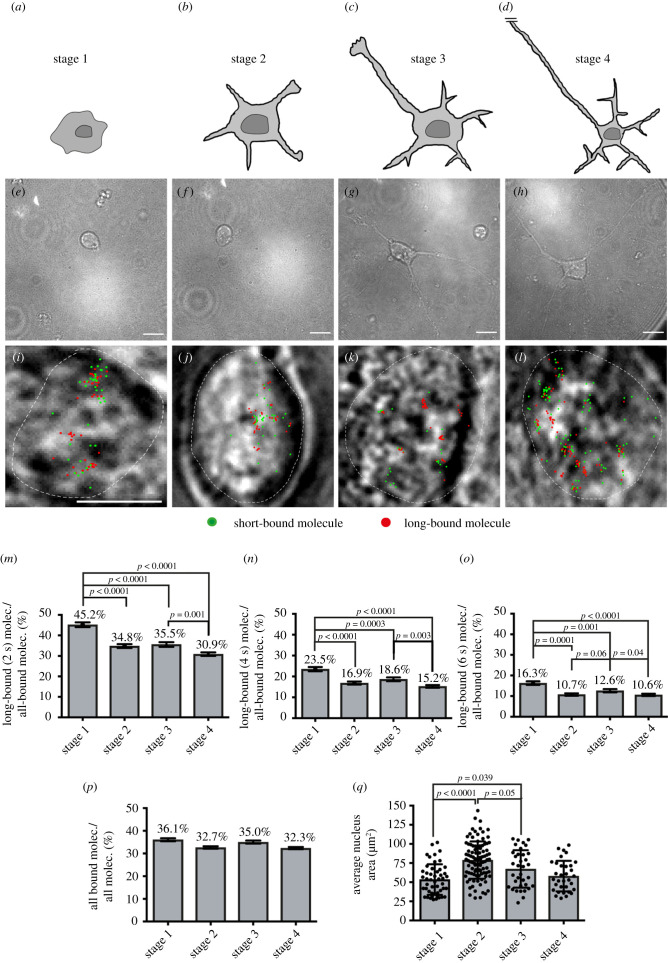
Figure 2.
The long-bound SRF fraction is enhanced at the initial stage of neuronal polarization. (a–d) Schematics illustrating stages of neuronal differentiation, namely initial cell adhesion (stage 1, 5 h after plating), neurite formation (stage 2, 24 h), axon specification (stage 3, 72 h) and axon-dendrite maturation and contact formation (stage 4, 7d). (i–l) Exemplary frames from ITM movies overlayed with the determined position from all bound molecules for the respective movie (short binding (green) and long-bound (red) molecules). Superimposed is the outline of the cell nucleus (white dashed line) determined from the respective bright field images. (i–l) Bright-field captures of nuclei (white dashed line) overlayed with a merged picture of the ITM movie indicating short- (green) and long-bound (red) molecules. (m–o) Fraction of long-bound versus all bound Halo-SRF molecules for the four differentiation stages determined from ITM movies using 2 s (m), 4 s (n) or 6 s (o) dark-times. (n = 1747 molecules in stage 1; n = 2465 molecules in stage 2; n = 1771 molecules in stage 3; n = 4827 molecules in stage 4). (p) Halo-SRF bound fraction (short and long binding) determined using ITM movies for all four differentiation stages. The fraction of all-bound Halo-SRF molecules was highest in stage 1, however no statistical significance (n = 4850 molecules, 49 cells in stage 1; n = 7506 molecules, 98 cells in stage 2; n = 5002 molecules, 35 cells in stage 3; n = 15 241 molecules, 33 cells in stage 4). Data represent molecule-wise analysis with mean ± error. p values and errors were calculated by the two-sample binomial test. (q) The average nucleus area/neuron was measured from the bright field image for each of the four differentiation stages. In stage 1, nucleus area was the lowest and in stage 2 the highest area was measured. Each dot represents one cell. Data are depicted as mean ± s.d. p-values were calculated by a two-sided ANOVA test. Scale bars: (e–h) 10 µm; (i–l) 5 µm.

