Figure 3.
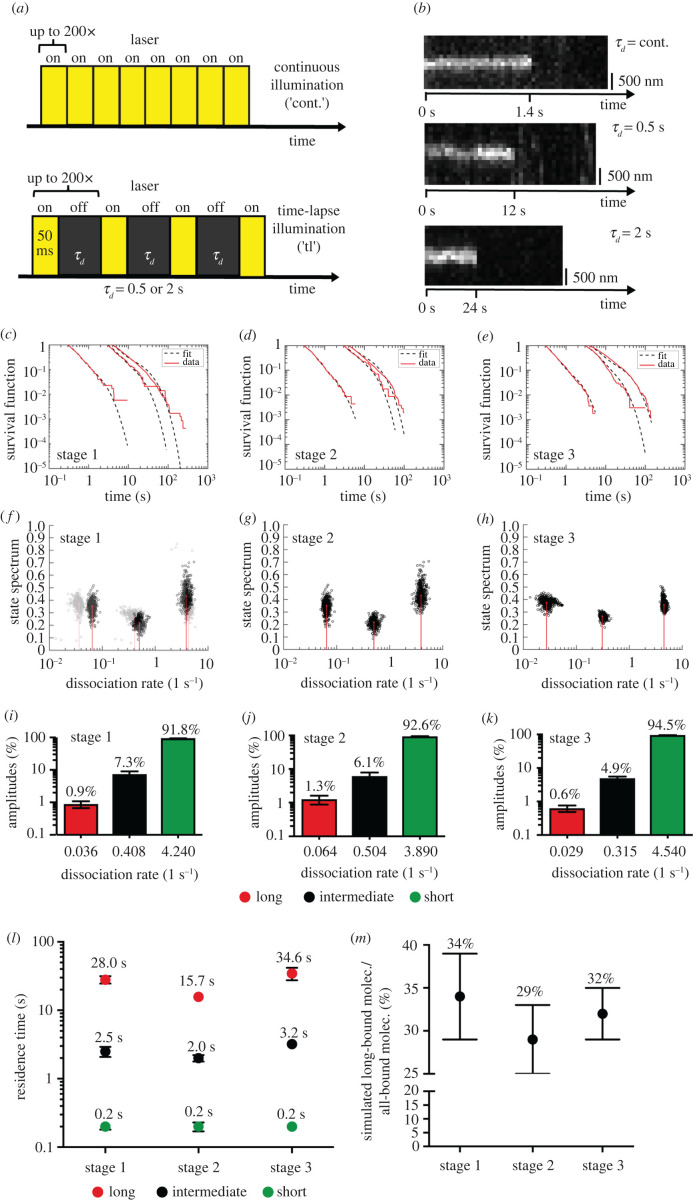
DNA residence times change during neuronal polarization. (a) Time-lapse illumination scheme for measuring residence time. The dark-time between two 50 ms illumination frames was varied between 0 (continuous movies) to 2 s. (b) Representative kymographs of bound-molecules under different time-lapse conditions. y-axes depict position and x-axes indicate time. (c–e) Computed probabilities of molecules binding for longer than a certain binding time computed from tracked Halo-SRF molecules using different time-lapse conditions (cont., 0.5 s and 2 s), shown are actual data (red) and fitted survival time functions obtained by a three-component decay model (black dashed line) for neurons in stage 1 (c), stage 2 (d) and stage 3 (e). (f–h) State spectra of Halo-SRF molecules obtained by a three-component decay model using all data (red lines) and a superposition of 500 results obtained by resampling of 80% of the data (black circles) as an error estimation for neurons in differentiation stage 1 (f), stage 2 (g) and stage 3 (h). (i–k) Event spectrum of the corresponding dissociation rates of Halo-SRF. The event spectra show the percentage distribution of Halo-SRF molecules for each calculated dissociation rate for neurons in stage 1 (i), stage 2 (j) and stage 3 (k). Data are presented as mean ± error resulting from three-component decay model fit. (l) Average DNA residence times obtained from dissociation rates for short-(green), intermediate (black) and long-bound (red) Halo-SRF molecules. Data were presented as mean ± s.d. : n = 387 molecules (stage 1), n = 530 molecules (stage 2), n = 555 molecules (stage 3); : n = 343 molecules (stage 1), n = 314 molecules (stage 2), n = 525 molecules (stage 3); : n = 2400 molecules (stage 1), n = 1037 molecules (stage 2), n = 864 molecules (stage 3). (m) Simulated long-bound fraction of the Halo-SRF molecules were simulated from the time-lapse dataset which was used to compute the DNA residence times. For long-bound fraction simulation, an ITM spectrum was calculated, which is corrected for the fact that short binding events are not detected during the dark-time in ITM (see Material and methods). This ITM spectrum was used to simulate the long-bound fraction. Here long-bound and short-bound events were classified by applying the same rules like in the evaluation of measured ITM movies. The results indicate an elevation of the Halo-SRF long-bound fraction in stage 1 neurons compared to those in differentiation stage 2 or 3. Data are presented as mean ± s.d.

