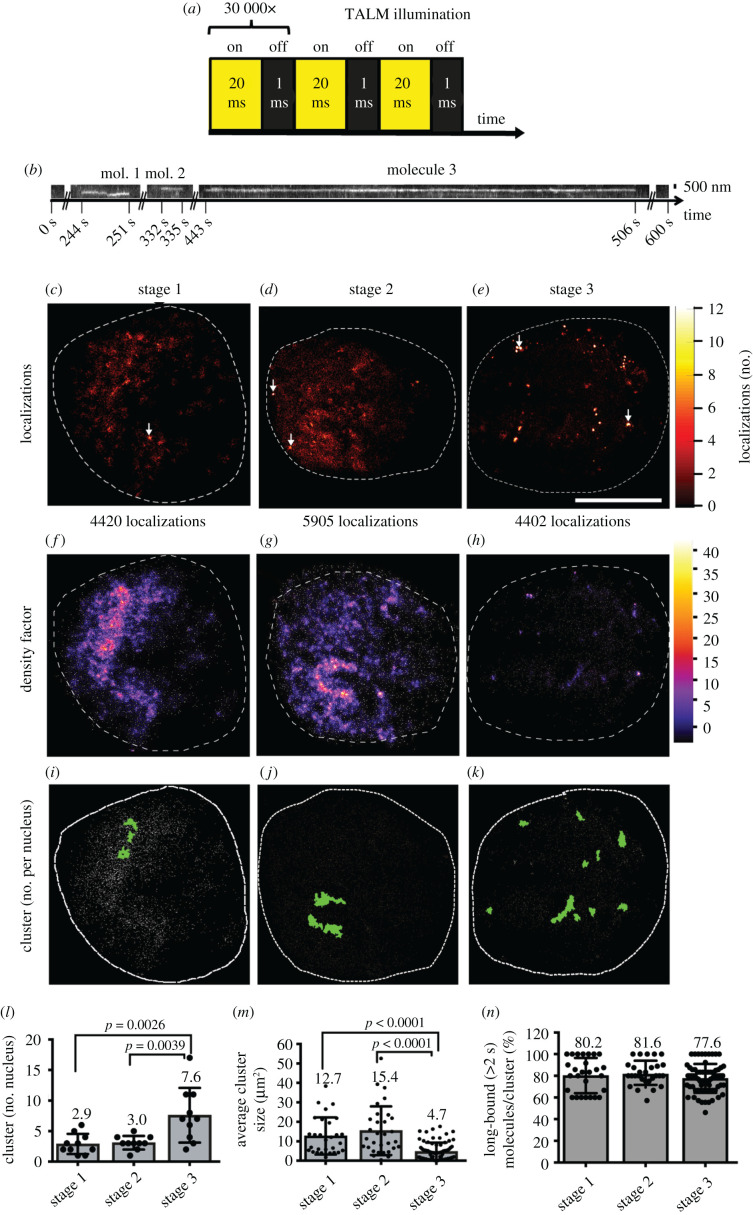
Figure 5.
TALM analysis shows different cluster sizes and number of SRF long-bound molecules during neuronal differentiation. (a) TALM illumination scheme. In TALM, Halo-SRF molecules labelled with the photoactivatable dye JF-646-PA were illuminated for 20 ms with a 640 nm laser line. In the camera integration time, the JF-646-PA-dye was activated for 1 ms. One sample was imaged for 30 000 frames. (b) Representative kymograph of three molecules detected at an identical area during an entire TALM movie (600 s). x-axis indicates the time and y-axis the position. (c–e) Upscaled super-resolution image of the detection map of all Halo-SRF localizations which were linked to tracks longer than 1 s in the nucleus of stage 1 (c), stage 2 (d) and stage 3 (e) neuron. The lookup table indicated the number of Halo-SRF localizations per pixel of the upscaled image (pixel size is 26 nm). White arrows indicate pixels with the highest number of localizations. (f–h) Local density factor map of initial Halo-SRF localization positions for exemplary neurons from stage 1 (f), stage 2 (g), and stage 3 (h). The local density factor was calculated by the Voronoi tesselation and is indicated by the lookup table. (i–k) Visualized clusters (green area) of initial Halo-SRF localization positions (white dots) in a neuron at stage 1 (i), stage 2 (j), and stage 3 (k) together with overlaid initial positions of Halo-SRF molecules determined in the respective movie (grey symbols). (l) Average number of Halo-SRF localization clusters in stages 1, 2 and 3, determined by SR-Tesseler cluster analysis algorithm. Data were displayed as mean ± s.d. n = 9 cells for each stage. p values were calculated by Mann–Whitney test. (m) Computed average size of Halo-SRF clusters, data are presented as mean ±s.d. One circle depicts one cluster analysed. n = 26 clusters (stage 1); n = 28 clusters (stage 2); n = 63 clusters (stage 3). p-values were calculated by Multicomparison ANOVA test. (n) The percentage of long-bound (greater than 2 s) molecules per cluster is depicted for all three stages. One circle depicts one cluster analysed (for n numbers see (m)). Scale bars: (b) 500 nm; (c–k) 5 μm.

