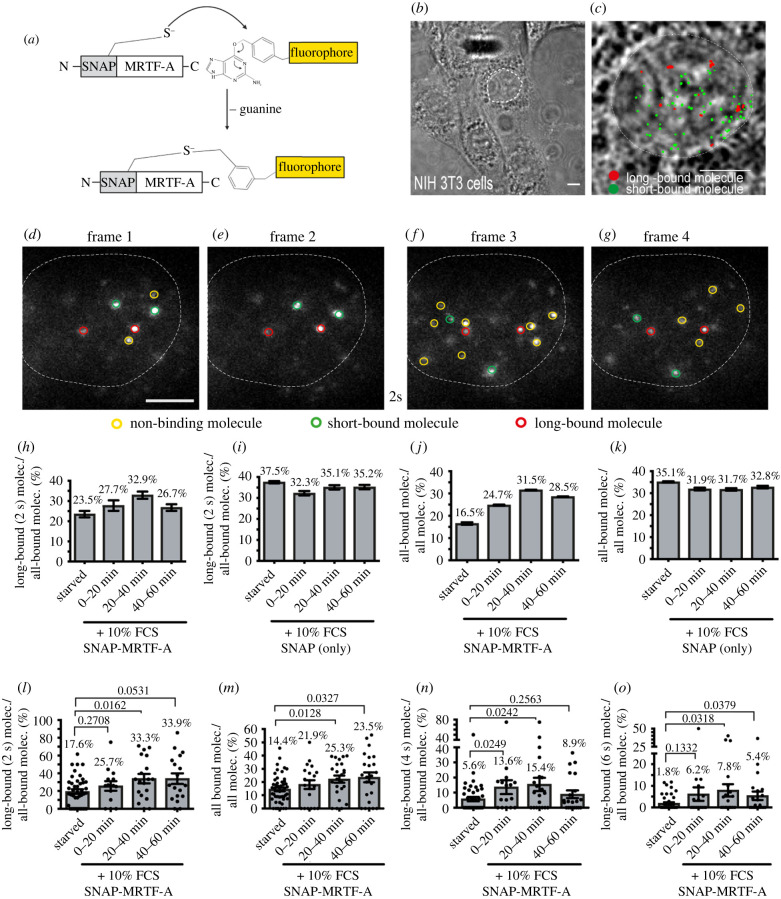
Figure 6.
The fraction of long-bound MRTF-A molecules is increased by serum stimulation. (a) Schematic showing how SNAP-tag was N-terminally fused to the wild-type MRTF-A protein and was labelled by adding a selective fluorophore. (b,c) Bright field image of NIH 3T3 cells (c). Exemplary frames from an ITM movie of a NIH 3T3 cells expressing SNAP-MRTF, overlayed with the determined position from all bound molecules for the respective movie (short binding (green) and long-bound (red) molecules). Superimposed is the outline of the cell nucleus (white dashed line) determined from the respective bright field images. (d–g) Representative examples of molecules imaged over four frames and one dark-time interval of 2 s. Yellow circled fluorescent spots represent non-binding molecules. Two long-bound molecules were present in all four frames (red circles), whereas two short-bound molecules were present in frames 1 and 2 and two other short-bound molecules were present in frames 3 and 4 (green circles). (h,i) NIH 3T3 cells expressing SNAP-MRTF-A (h) or SNAP alone (i) were starved or stimulated with 10% FCS and the fraction of long-bound to all-bound molecules was computed. (h) n = 706 molecules, 26 cells for starved; n = 284 molecules, 21 cells for 0–20 mins FCS; n = 492 molecules, 25 cells for 20–40 mins FCS; n = 599 molecules, 20 cells for 40–60 mins FCS. (i) n = 2588 molecules, 26 cells for starved; n = 1846 molecules, 11 cells for 0–20 mins FCS; n = 2149 molecules, 15 cells for 20–40 mins FCS; n = 2172 molecules, 10 cells for 40–60 mins FCS. (j,k) The all bound fraction (short and long) was quantified for NIH 3T3 cells expressing SNAP-MRTF-A (j) or SNAP alone (k). (j) n = 4274 molecules for starved; n = 1336 molecules for 0–20 mins FCS; n = 1794 molecules for 20–40 mins FCS; n = 2056 molecules for 40–60 mins FCS. (k) n = 7745 molecules for starved; n = 6212 molecules for 0–20 mins FCS; n = 6773 molecules for 20–40 mins FCS; n = 6320 molecules for 40–60 mins FCS. Data in (h–k) were analysed molecule-wise and depict mean ± error. The error was calculated by a two-sample binomial test. (l–o) In cells expressing SNAP-MRTF-A the long-bound fraction (2 s; l) and all-bound (m) fraction was determined after FCS stimulation by cell-wise quantification. In order to account for binding times on the order of seconds also dark-times of 4 s (n) or 6 s (o) were analysed. Each dot reflects one cell (n = 26 cells starved; n = 21 cells 0–20 min FCS; n = 25 cells 20–40 min FCS; n = 20 cells 40–60 min FCS). Data in (l–o) were analysed cell-wise and depict mean ± s.d. p-values were calculated by the Mann–Whitney test. Scale bars: (c,d–g) 5 µm.

