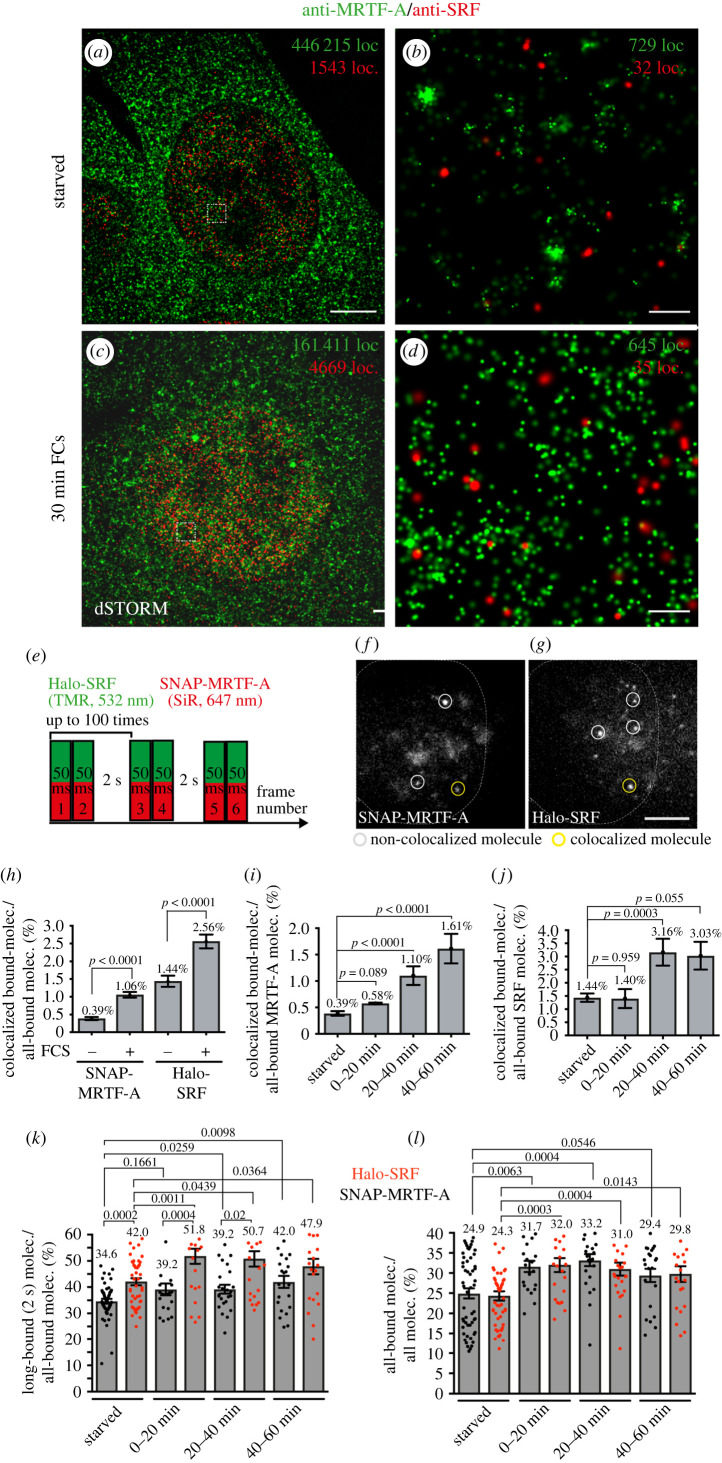
Figure 7.
Enhanced SRF and MRTF-A colocalization in SMT experiments in living cells after stimulation. (a–d) Super-resolution optical microscopy (dSTORM) imaging of starved (a,b) or FCS-stimulated (c,d) NIH 3T3 cells simultaneously expressing Halo-SRF and SNAP-MRTF-A (n = 3 cells each condition). Cells were immuno-labelled with ant-MRTF-A (green) and anti-SRF (red) directed antibodies. Higher magnifications (b,d) of areas in boxes in (a,c) reveal clusters of localizations. (e) ITM illumination scheme with a simultaneous illumination of Halo-SRF stained with TMR (532 nm) and SNAP-MRTF-A stained with SiR (647 nm). The fluorophores were simultaneously illuminated for two consecutive frames of 50 ms, followed by a dark-time of 2 s. (f–g) Exemplary frame of an ITM movie taken from an NIH 3T3 cell expressing Halo-SRF and SNAP-MRTF-A. Images detecting SNAP-MRTF-A (f) and Halo-SRF (g) were recorded simultaneously using two separated camera channels. The yellow circle in both frames computed from an overlay of the two images indicates a SNAP-MRTF molecule colocalized with a Halo-SRF molecule. By contrast, the grey circles indicate SNAP-MRTF-A and Halo-SRF molecules non-colocalized (h–j) The bound fraction of SNAP-MRTF and Halo-SRF molecules was quantified for-colocalization in starved or stimulated NIH 3T3 cells. H: SNAP-MRTF-A (n = 21 191 molecules starved, n = 16 707 molecules stimulated) and Halo-SRF (n = 5707 molecules starved, n = 6680 molecules stimulated). MRTF-A molecules analysed for colocalization with SRF (i) were n = 21 191 (starved), n = 5276 (0–20 min FCS), 6885 molecules (20–40 min FCS) and n = 4546 molecules (40–60 min). Conversely, numbers for Halo-SRF molecules colocalizing with all-bound SNAP-MRTF-A molecules were n = 5707 molecules (starved), n = 2159 molecules (0–20 min FCS), n = 2374 molecules (20–40 min FCS) and n = 2147 molecules (40–60 min FCS). All data showed mean and p values and error were calculated using a two-sample binomial test. (k–l) In starved and stimulated NIH 3T3 cells co-expressing SNAP-MRTF-A and Halo-SRF, the long-bound (k) and all-bound fraction (l) of Halo-SRF (red) and SNAP-MRTF-A (black) molecules was determined cell-wise. Data in (k,l) were quantified cell-wise and were depicted as mean ± s.d. In (k,l) each dot represented one cell (n = 54 cells starved; n = 70 cells 0–20 min FCS; n = 25 cells 20–40 min FCs and n = 22 cells 40–60 min FCS). All p-values were calculated by the Mann–Whitney test. Scale bars: (a,c) 5 µm; (b,d) 200 nm (f,g) 5 µm.

