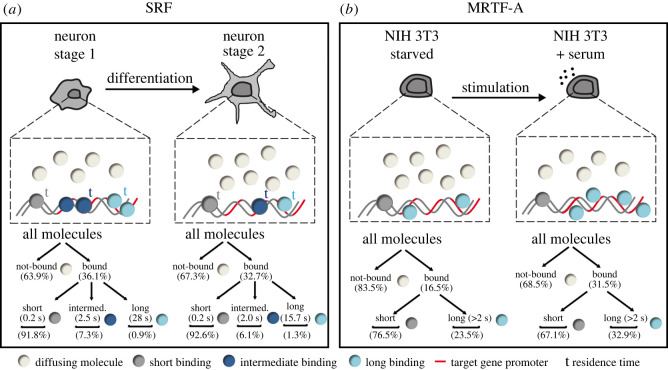
Figure 8.
Summary scheme. (a) (top) Scheme depicting the changes in nuclear SRF kinetics during neuronal differentiation comparing stage 1 and stage 2 neurons. The DNA residence time (t) of long-bound (light blue) and intermediate-bound (dark blue) molecules were increased in stage 1 compared to stage 2. Higher residence times are indicated by larger letters in bold. In addition, the fraction of long- and intermediate bound SRF molecules (indicated by circle numbers) was also elevated in stage 1 compared to stage 2. (bottom) Percentages of bound-fractions and residence times were summarized for comparing stage 1 with stage 2. (b) Scheme depicting the findings for SMT experiments with SNAP-MRTF-A in starved and stimulated NIH 3T3 cells. In ITM experiments, serum stimulation enhanced the fraction of all-bound and long-bound MRTF-A molecules. No definitive binding times were calculated for SNAP-MRTF-A.

