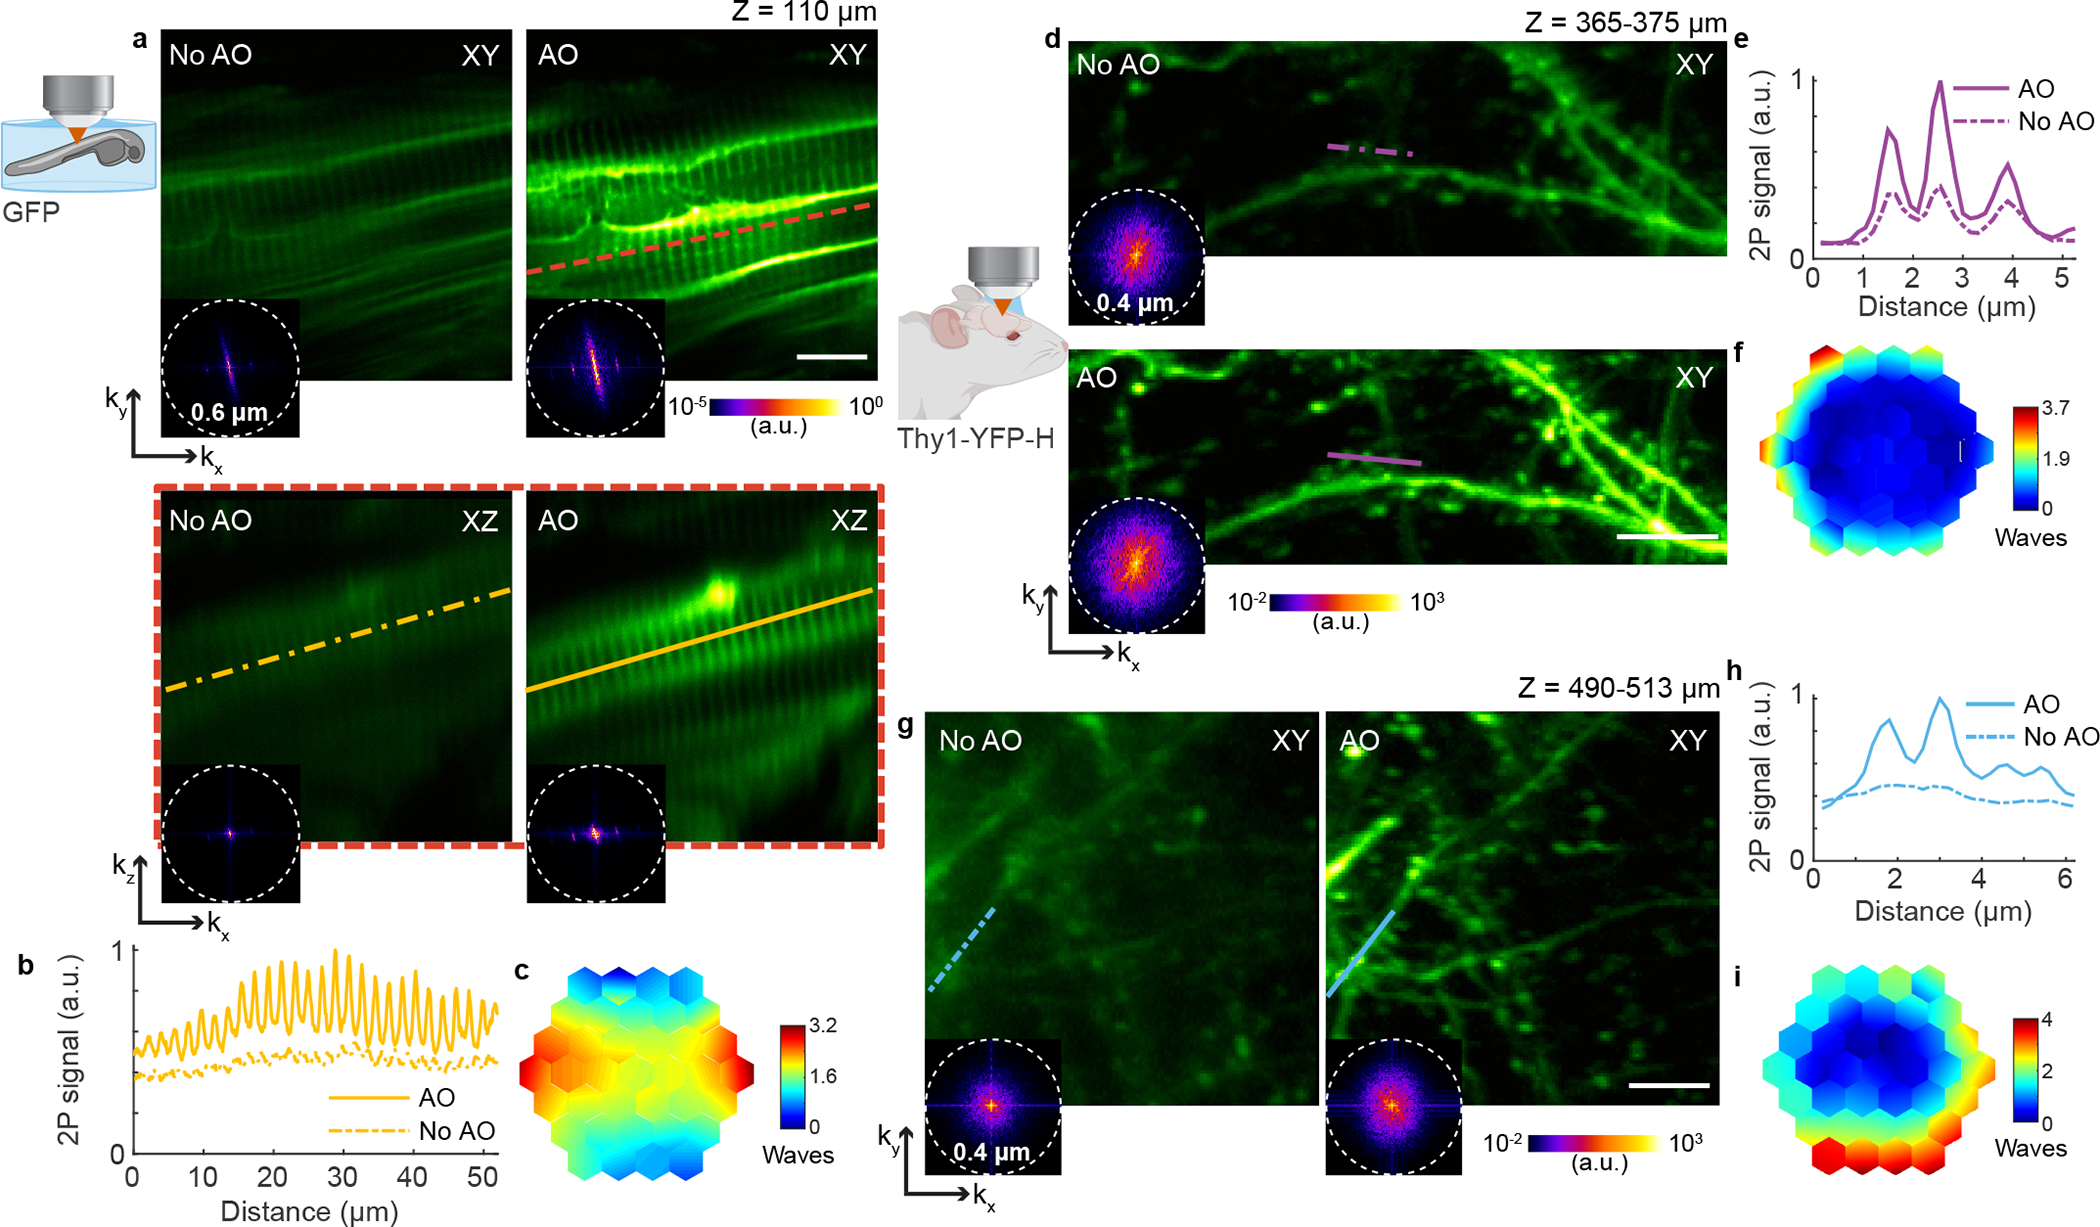
Fig. 1 |. AO improves in vivo 2P imaging of myotomes in zebrafish larva and neuronal structures in the mouse brain.

a, Lateral and axial (along red dashed line) images of myotomes in the mid-trunk of a 4-day-old zebrafish larva Tg(β-actin:HRAS-EGFP), at an imaging depth of 110 μm from the surface, without and with AO (phase modulation). Post-objective power: 13 mW. b, Signal profiles in the axial plane along the yellow lines in a. c, Corrective wavefront in a. d-i, Imaging of dendrites in the cerebral cortex of Thy1-YFP-H mice. d,g, Maximum intensity projections of dendrites at 365–375 μm and 490–513 μm below dura, respectively, under 920 nm excitation, without and with AO (phase modulation). Post-objective power: 31 (d) and 128 mW (g). e,h, Signal profiles along the purple and blue lines in d and g, respectively. f,i, Corrective wavefronts in d and g, respectively. Insets in a, d, and g: spatial frequency space representations of the corresponding fluorescence images; dashed circles: diffraction-limited resolution. Scale bars, 10 μm in a and 5 μm in d and g. Microscope objective: NA 0.8 16× for a and NA 1.05 25× for d and g. Zebrafish imaging: representative results from 3 fields of view and 2 zebrafish larvae; mouse brain imaging: representative results from 13 fields of view and 3 mice.
