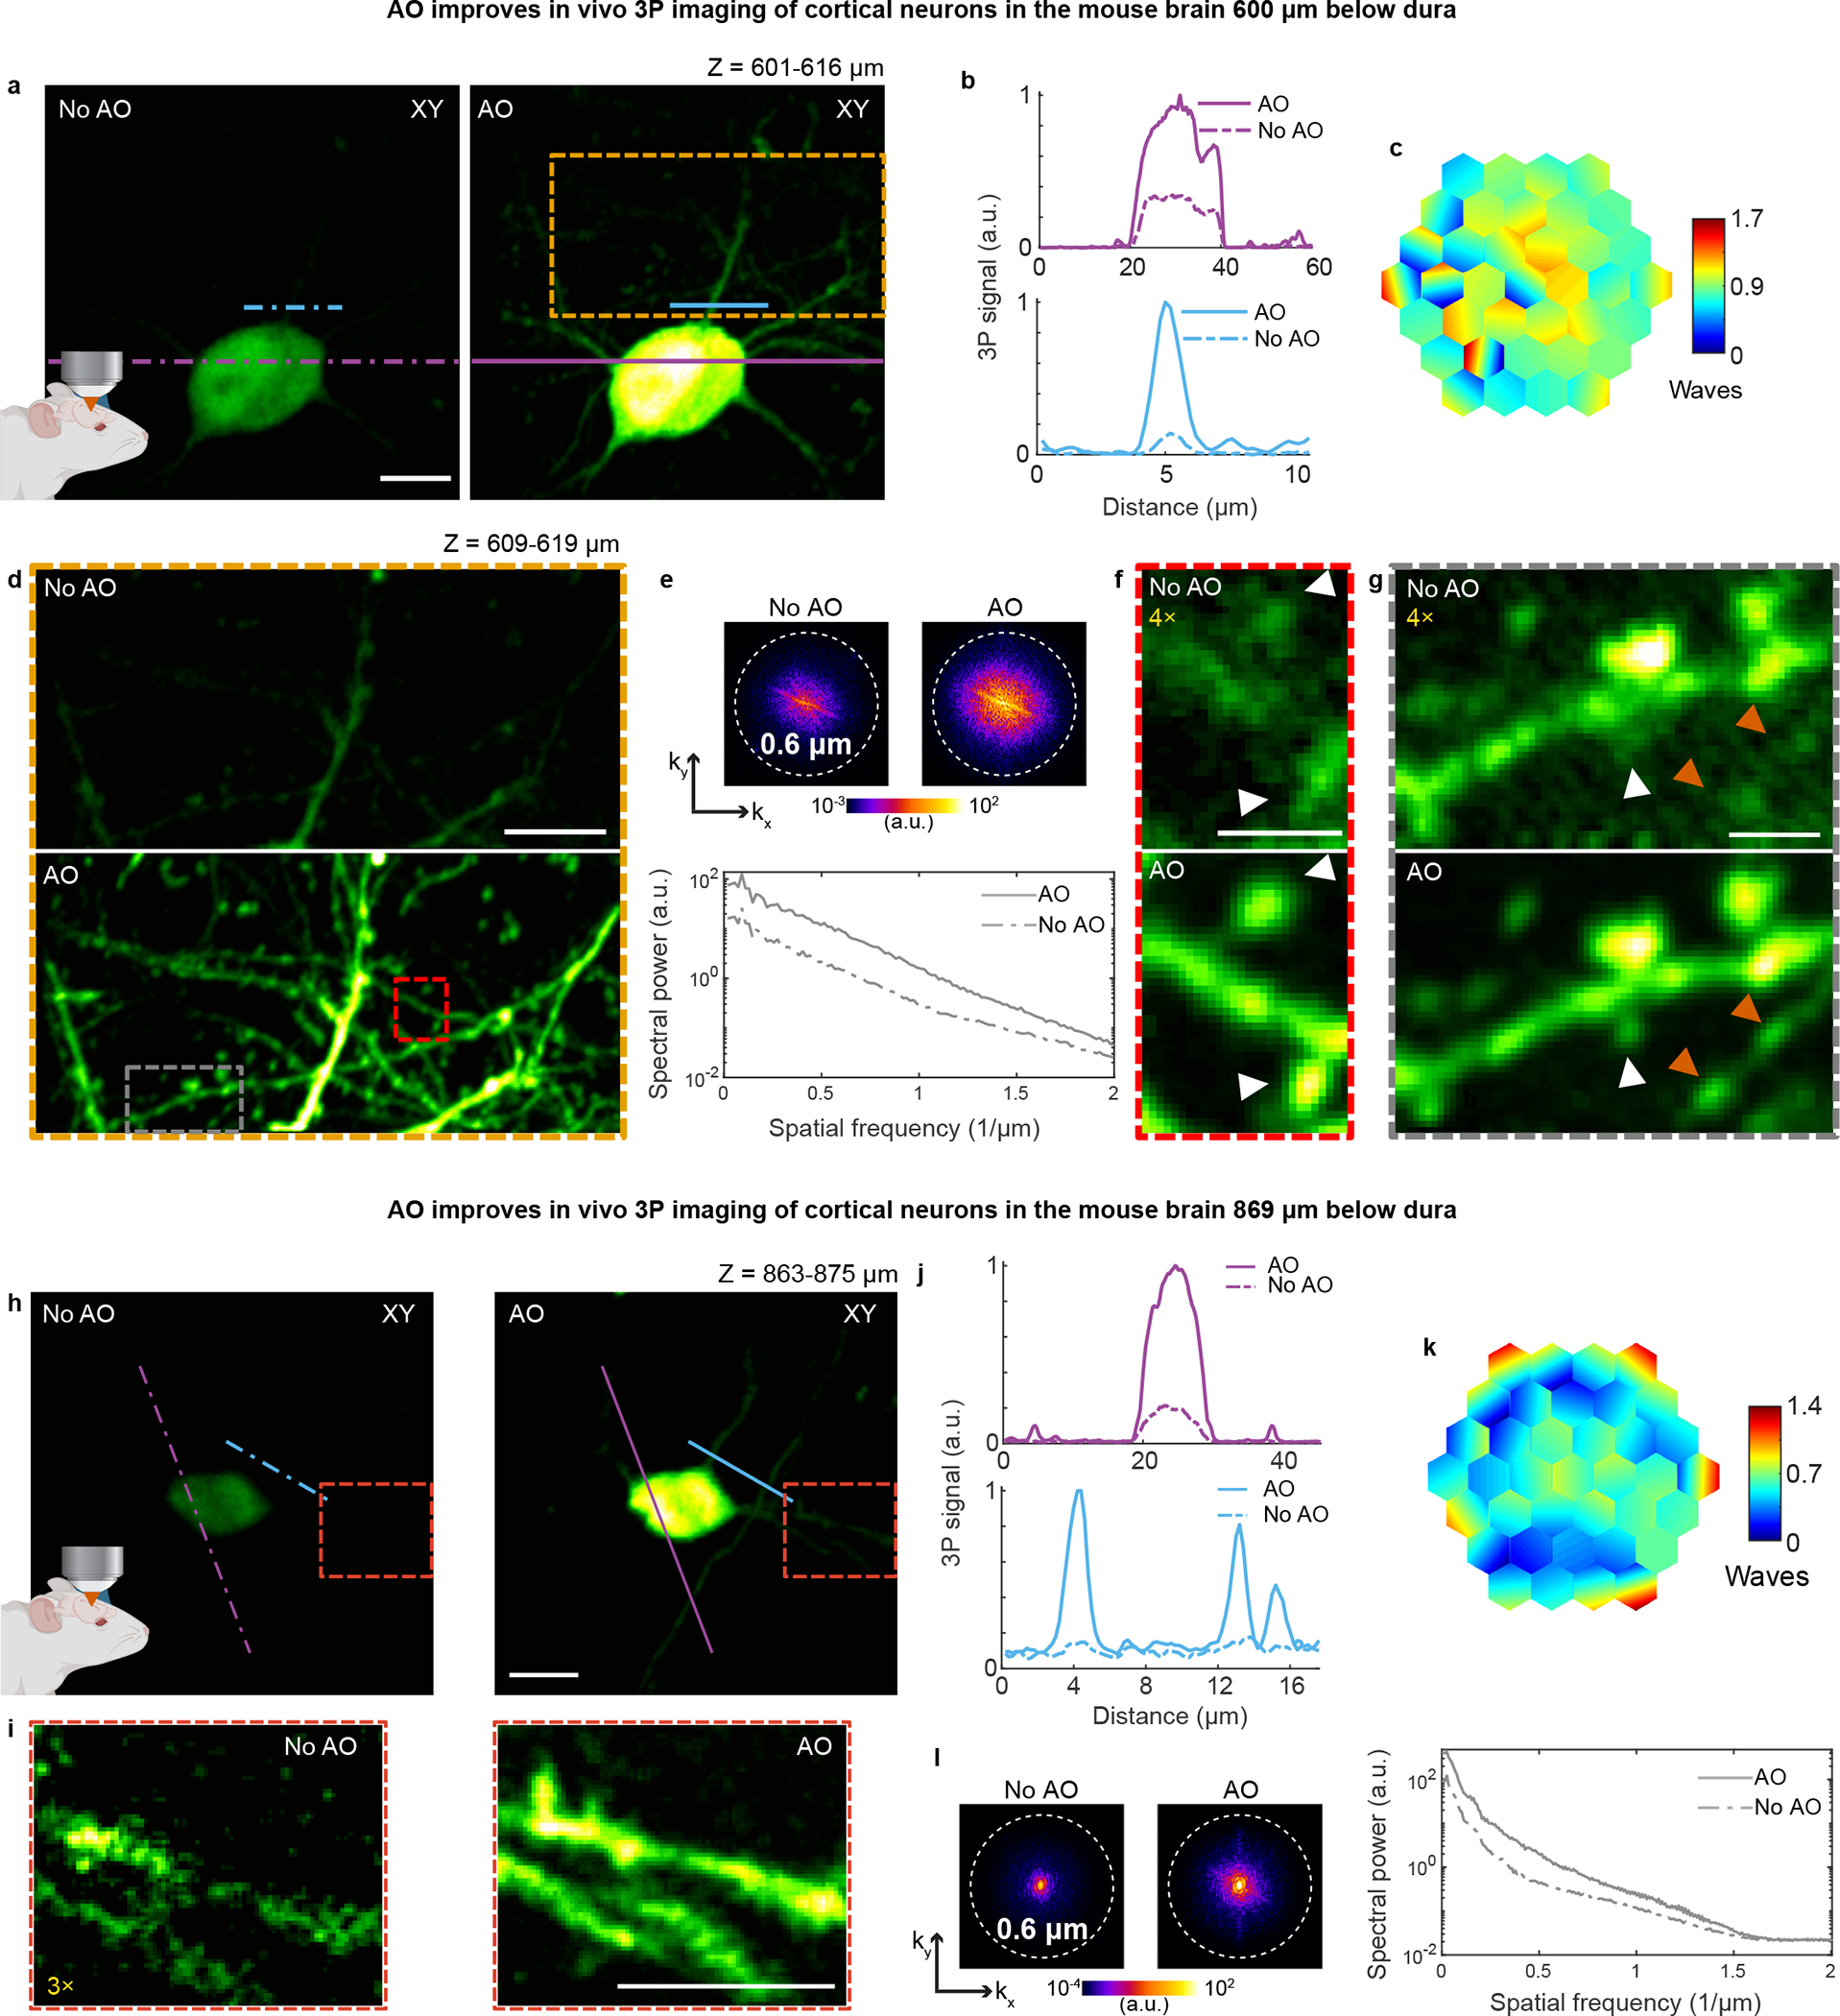
Extended Data Fig. 8 |. AO enables in vivo 3P imaging of dendritic spines and axonal boutons in deep layers of the mouse cortex.

a, Maximum intensity projection (MIP) of a neuron in the mouse cortex (Thy1-YFP-H), at 601–616 μm below dura, under 1300 nm excitation, without and with AO. Post-objective power: 17 mW. b, Signal profiles along the purple and blue lines in a. c, Corrective wavefront in a. d, MIP of the orange box in a, at 609–619 μm below dura, without and with AO. Post-objective power: 25.6 mW. e, Spatial frequency space representations of the images in d (top) and their radially averaged profiles (bottom). f,g, Zoomed-in views of the red and gray boxes in d, respectively. 4× digital gain was applied to images without AO to improve visibility. White arrowheads: dendritic spines; orange arrowheads: axonal boutons. h, MIP of a neuron in the mouse cortex (Thy1-YFP-H), at 863–875 μm below dura, under 1300 nm excitation, taken without and with AO. Post-objective power: 42 mW. i, Zoomed-in views of the red box in h. 3× digital gain was applied to the image taken without AO to improve visibility. j, Signal profiles along the purple and blue lines in h. k, Corrective wavefront in h. l, Spatial frequency space representation of the images in h (left) and their radially averaged profiles (right). Scale bars: 10 μm in a, d, h, and i; 2 μm in f and g. Microscope objective: NA 1.05 25×. Representative results from 20 fields of view and 5 mice.
