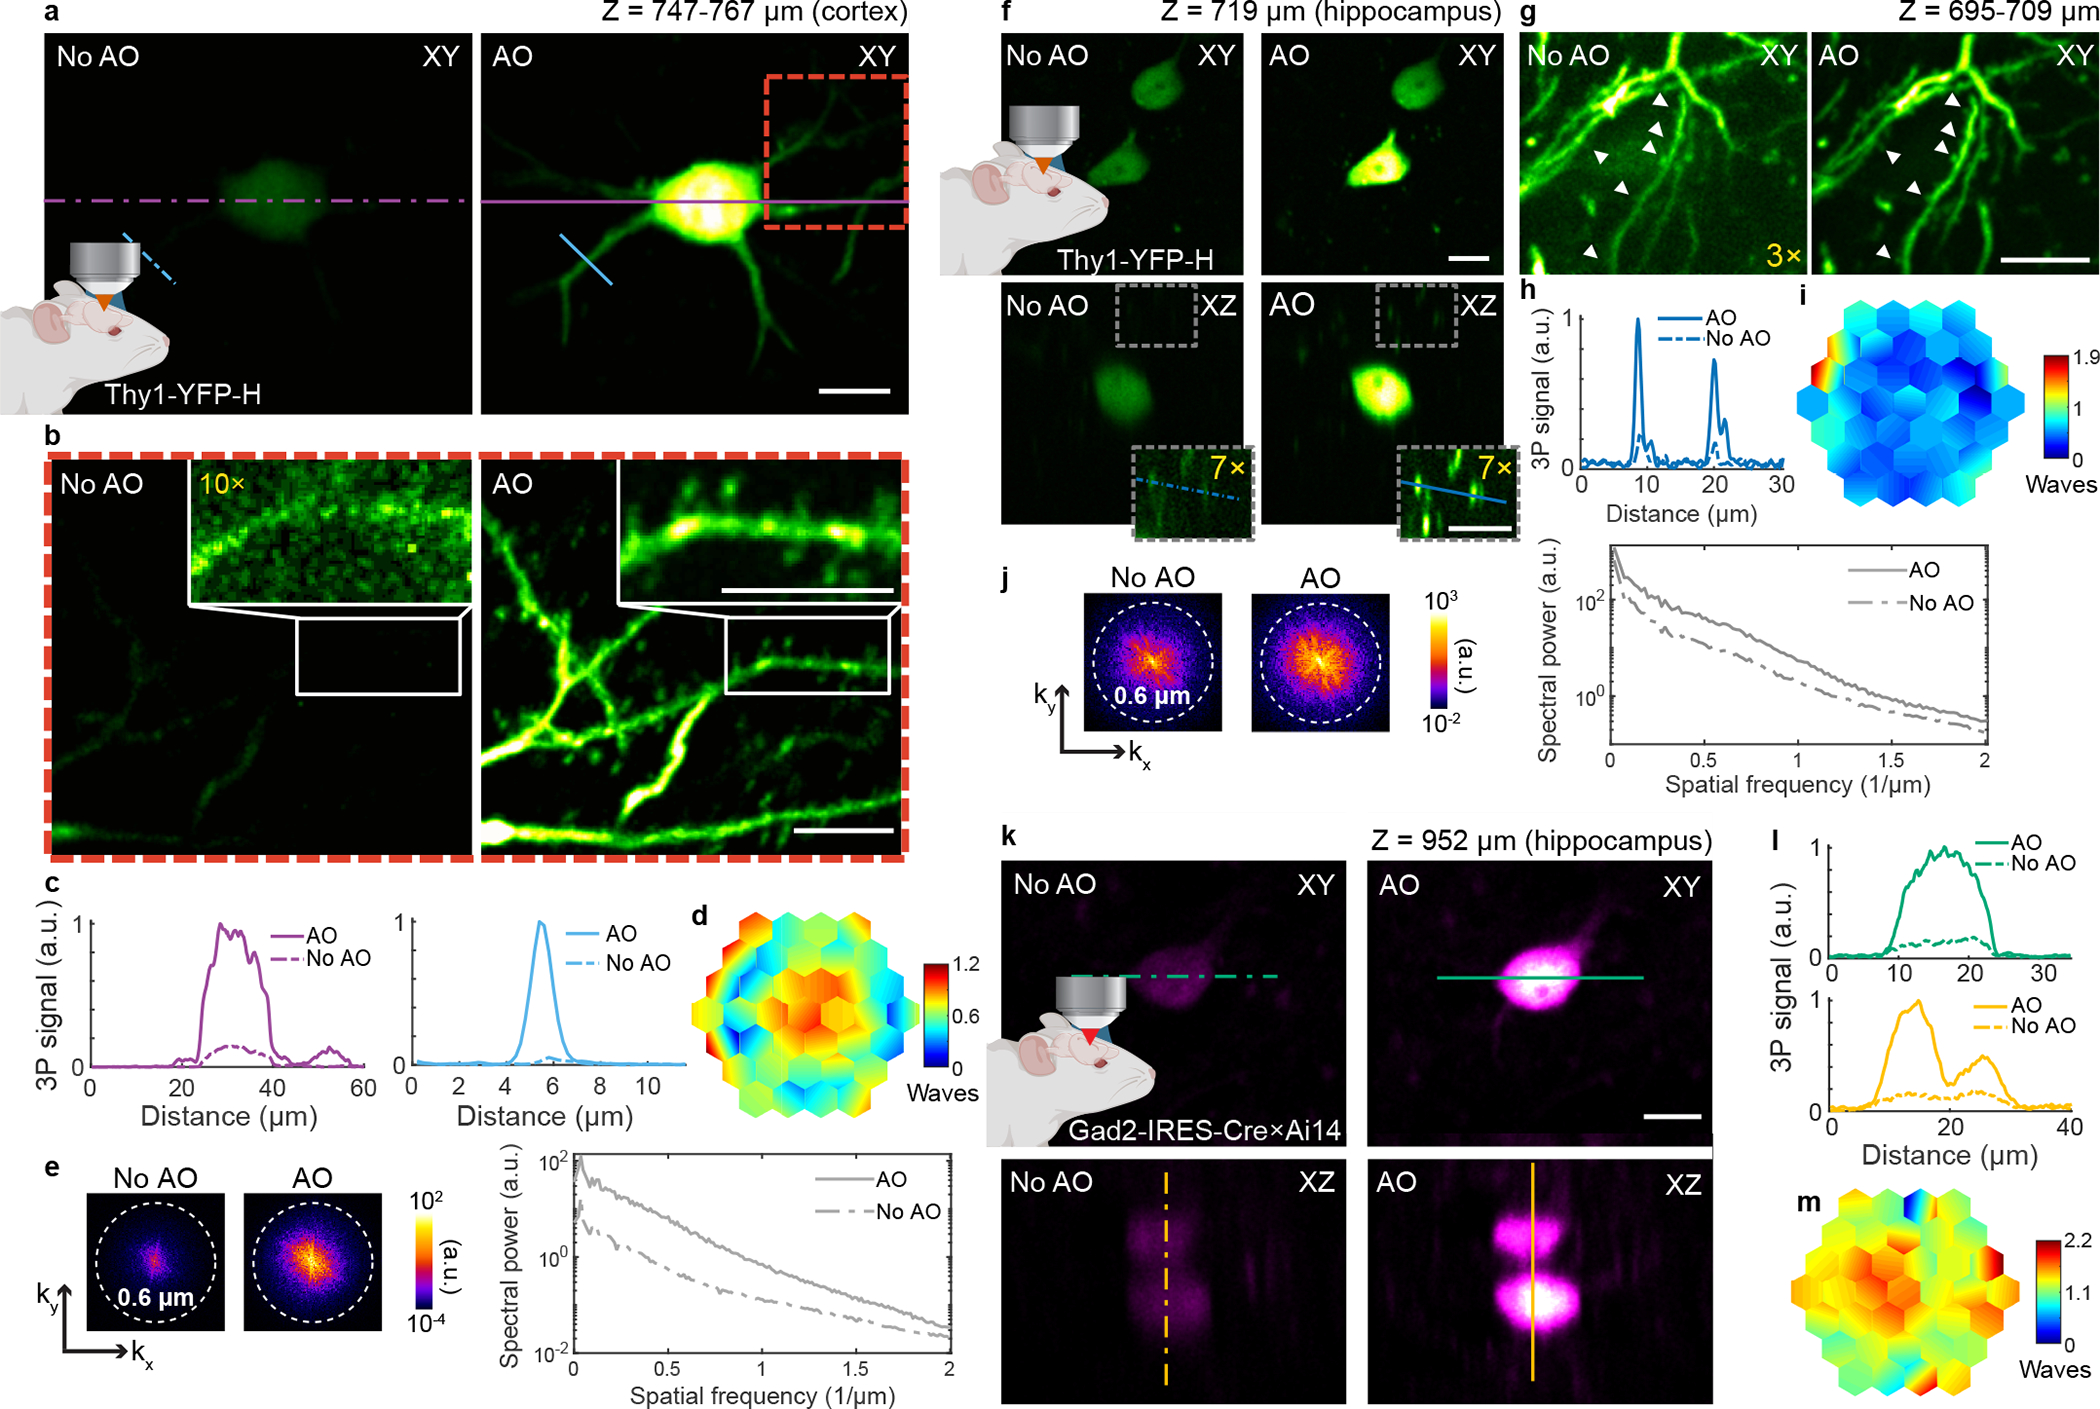
Fig. 2 |. AO enables in vivo 3P imaging of cortical and hippocampal neuronal structures in the mouse brain, with subcellular resolution.

a, Maximum intensity projection (MIP) of a neuron in the mouse cortex (Thy1-YFP-H), at 747–767 μm below dura, under 1300 nm excitation, without and with AO (phase modulation). Post-objective power: 17 mW. b, Zoomed-in views of the red square in a, at 751–767 μm below dura, without and with AO. Insets, zoomed-in views of the dendrite in white rectangles in b. 10× digital gain was applied to No AO inset to increase visibility. Post-objective power: 20 mW. c, Signal profiles along the purple and blue lines in a. d, Corrective wavefront in a and b. e, Spatial frequency space representations of the images in b (left) and their radially averaged profiles (right). f, Lateral and axial images of neurons in the mouse hippocampus (Thy1-YFP-H), 719 μm below dura, under 1300 nm excitation, without and with AO (phase modulation). Post-objective power: 16 mW. Insets, zoomed-in views of the gray square in e. 7× digital gain was applied to increase visibility. g, MIP of neuronal processes above the cell body in e, at 695–709 μm below dura, without and with AO. White arrows: dendritic spines. Post-objective power: 26 mW. 3× digital gain was applied to image without AO to improve visibility. h, Signal profiles along the blue lines in e. i, Corrective wavefront in e and f. j, Spatial frequency space representations of the images in g (left) and their radially averaged profiles (right). k, Lateral and axial images of neurons in the mouse hippocampus (Gad2-IRES-Cre × Ai14 (Rosa26-CAG-LSL-tdTomato)), 952 μm below dura, under 1700 nm excitation, without and with AO (phase modulation). Post-objective power: 30 mW. l, Signal profiles along the green and yellow lines in i. m, Corrective wavefront in k. Scale bars, 10 μm. Microscope objective: NA 1.05 25×. Cortical imaging: representative results from 32 fields of view and 8 mice; hippocampal imaging: representative results from 15 fields of view and 4 mice.
