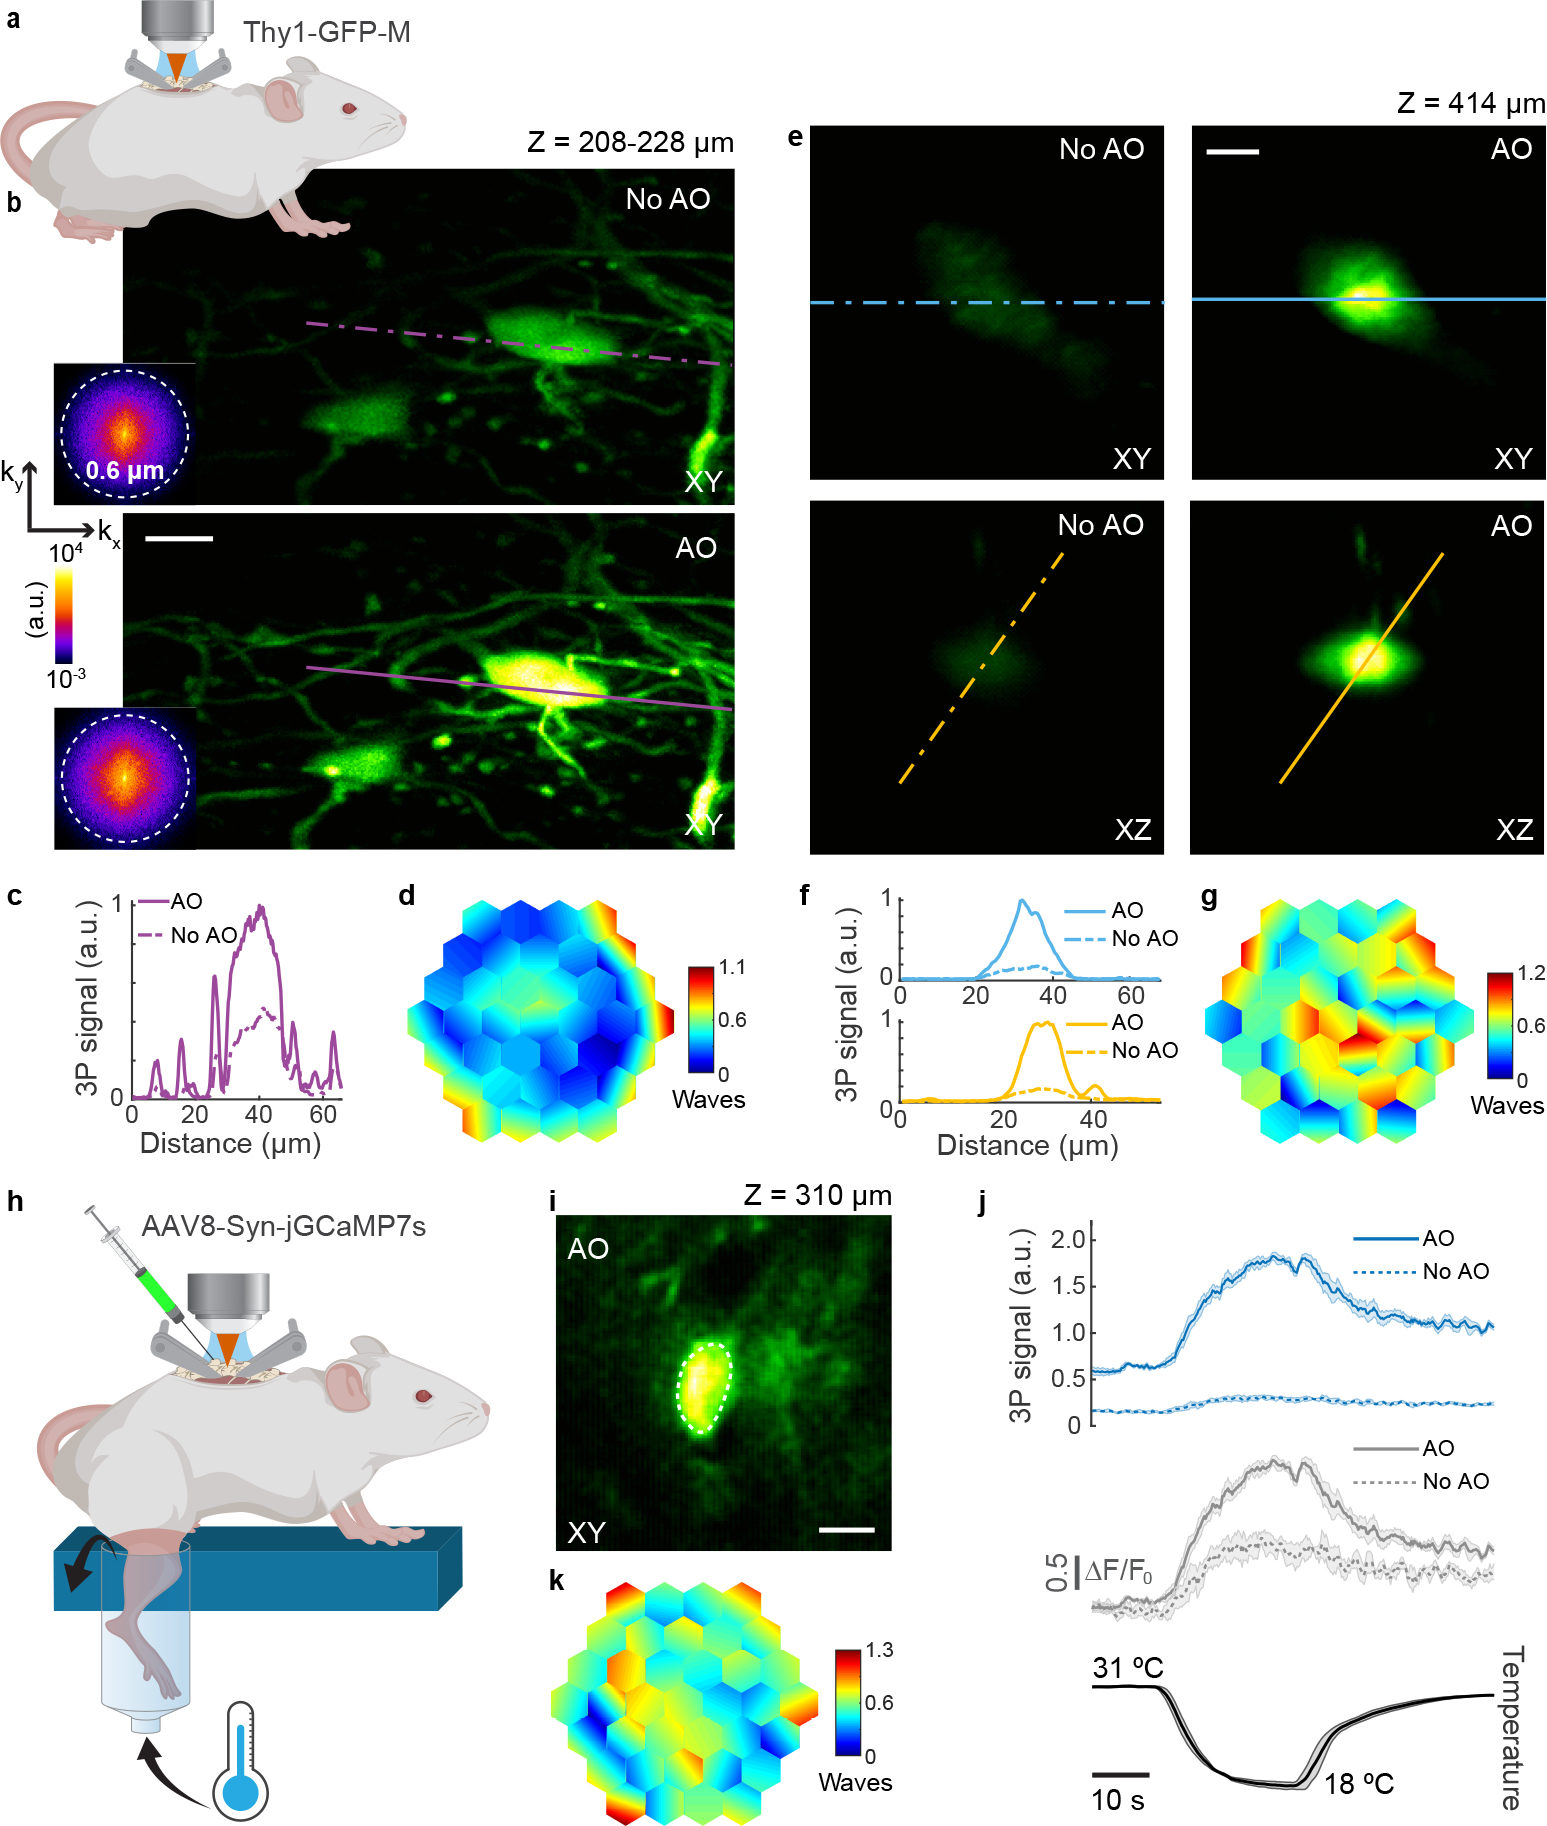
Fig. 3 |. AO improves in vivo 3P structural and functional imaging in the mouse spinal cord.

a, Schematic of in vivo imaging in the dorsal horn of the mouse spinal cord. b, Maximum intensity projection of spinal cord neurons (Thy1-GFP-M), 208–228 μm below dura, under 1300 nm excitation, without and with AO (phase modulation). Insets: spatial frequency space representations of the corresponding fluorescence images. Post-objective power: 18.3 mW. c, Signal profiles along the purple lines in b. d, Corrective wavefront in b. e, Lateral and axial images of a neuron (Thy1-GFP-M), 414 μm below dura, under 1300 nm excitation, without and with AO (phase modulation). Post-objective power: 89 mW. f, Signal profiles along the blue and yellow lines in e. g, Corrective wavefront in e. h, Schematic for recording calcium activity in jGCaMP7s-expressing neurons of the dorsal horn in the mouse spinal cord (AAV8-Syn-jGCaMP7s), in response to cooling stimuli applied to the skin of the hindlimb. i, Lateral image of a neuron, 310 μm below dura, under 1300 nm excitation, after AO correction. j, (top) 3P fluorescence signal and (middle) calcium transients (ΔF/F0), during (bottom) temperature stimulation, without and with AO (phase modulation), for the neuronal cell body shown in i. 4-trial average; shaded area: s.e.m. Post-objective power: 4.2 mW. k, Corrective wavefront in i. Scale bars, 10 μm. Microscope objective: NA 1.05 25×. Structural imaging: representative results from 7 fields of view and 3 mice; functional imaging: representative results from 3 fields of view, and 2 mice.
