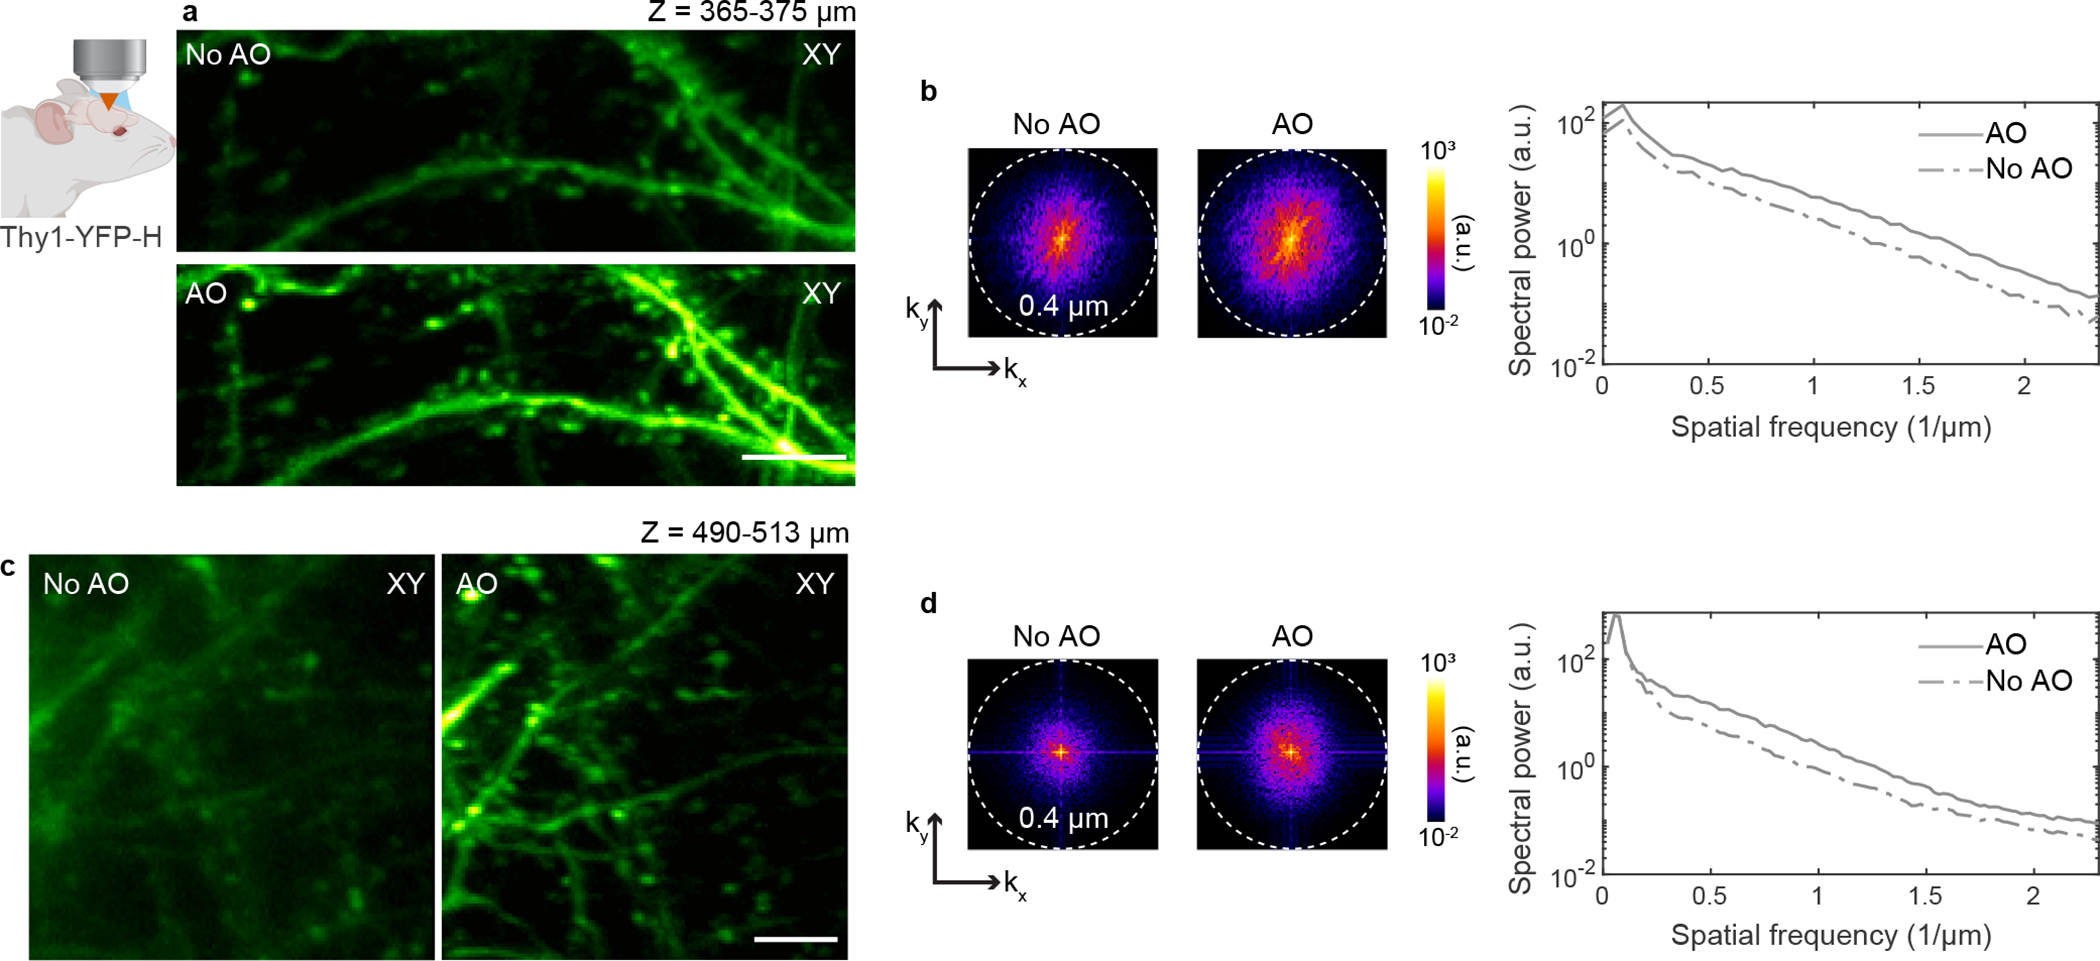
Extended Data Fig. 4 |. AO recovers spatial frequency components in 2P images of neuronal structures in the living mouse brain.

a-d, Imaging of dendrites in the cerebral cortex of Thy1-YFP-H mice. a,c, Maximum intensity projections of dendrites at 365–375 μm and 490–513 μm below dura, respectively, under 920 nm excitation, without and with AO (same images as in Fig. 1). b,d, Spatial frequency space representations of the 2P images in a and c, respectively (left), and their radially averaged profiles (right). Scale bars, 5 μm. Microscope objective: NA 1.05 25×. Representative results from 13 fields of view and 3 mice.
