. 2018 Nov 19;8(68):38872–38882. doi: 10.1039/c8ra06832a

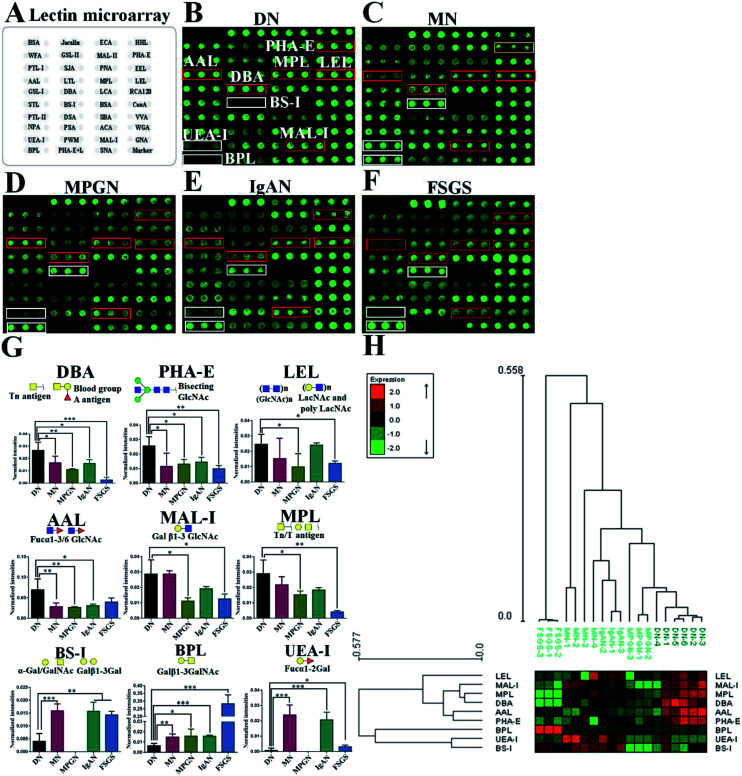
Fig. 1. Comparision of glycan patterns of serum glycoproteins between DN and NDRD groups. (A) Layout of lectin microarray. The profile of Cy3-labelled serum proteins from DN (B), MN (C), MPGN (D), IgAN (E) and FSGS (F) bound to the lectin microarrays, respectively. The lectins showing significantly increased or decreased in DN compared to four NDRD groups were marked with red or white frames. (G) The NFIs of 9 lectins were significantly different in DN compared to NDRD groups (including MN, MPGN, IgAN and FSGS) reference based on fold change and One-way ANOVA (*p < 0.05, **p < 0.01, and ***p < 0.001). The data are presented as the averaged NFI ± SD. (H) Heat map and hierarchical clustering analysis of the 9 lectins exhibiting significantly difference NFIs between DN and NDRD. Glycan profiles of DN and NDRD groups (including MN, MPGN, IgAN and FSGS) were clustered (average linkage, correlation similarity). Samples are listed in columns and the lectins are listed in rows. The color and intensity of each square indicated expression levels relative to other data in the row. Red, high; green, low; black, medium.

Fig. 1